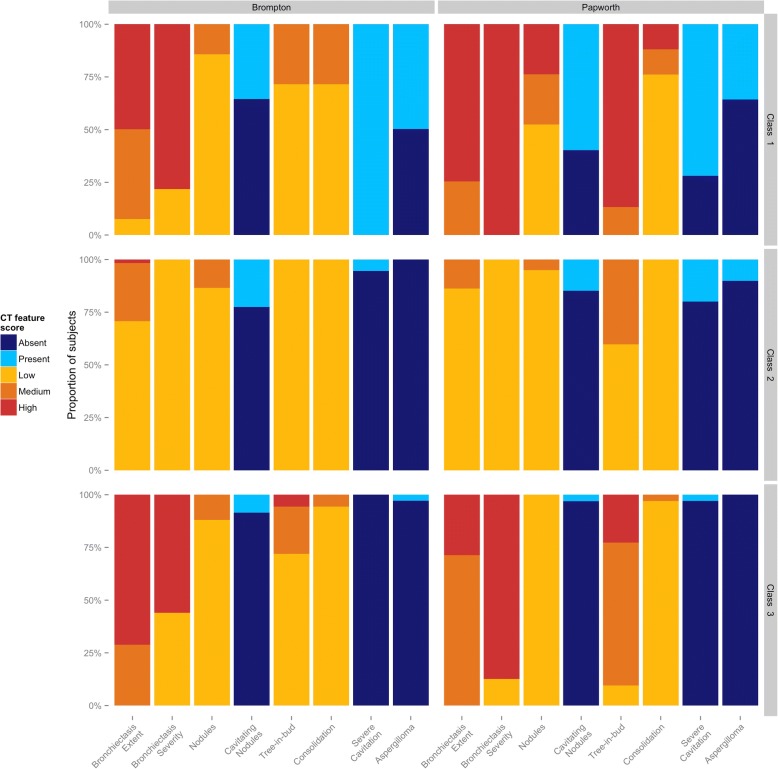
Fig. 1.
CT features of latent classes identified in the Royal Brompton (left panel) and Papworth (right panel) cohorts. The three classes identified by latent class analysis in each cohort are shown in the top, middle and bottom panels. The individual CT features used in the NTM scoring system are shown on the x-axes and the proportion of subjects on the y-axes. Colours represent the severity (low, medium or high), or the presence or absence of the CT feature

