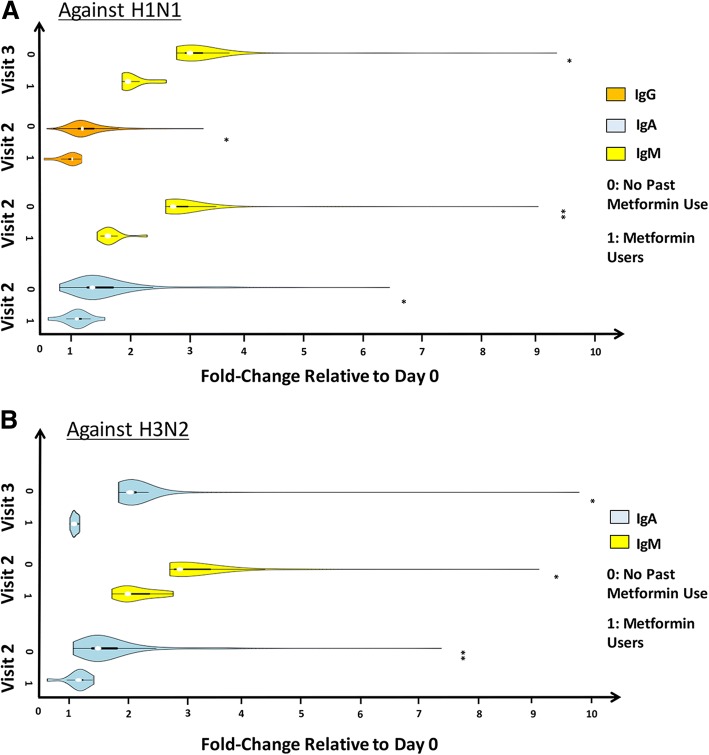
Fig. 2.
Isotypes of influenza virus-specific antibodies. Antibody isotype responses to H1N1 and H3N2 viruses in elderly individuals with a history of Metformin use compared to individuals with no prior drug use history are shown. Serum samples collected before and on two separate visits following vaccination were tested for IgA, IgG and IgM to H1N1 (a) and H3N2 (b) viruses by ELISA. The violin plots show the median Ab increases relative to pre-vaccination titers in elderly individuals with a history of Metformin use (1 on the Y-axis) compared with individuals with no prior drug use history (0 on the Y-axis). The white dots in within the plots show the median results, the bold black line within the plots shows the interquartile range, the thickness of the plot indicates the distribution of changes. Pair-wise differences between the two cohorts in each of the six panels were performed using the non-parametric Mann-Whitney U Test. Stars on the right of the plots indicate significant differences: * a p-value ≤0.05, ** p-value ≤0.005

