
Fig. 4.
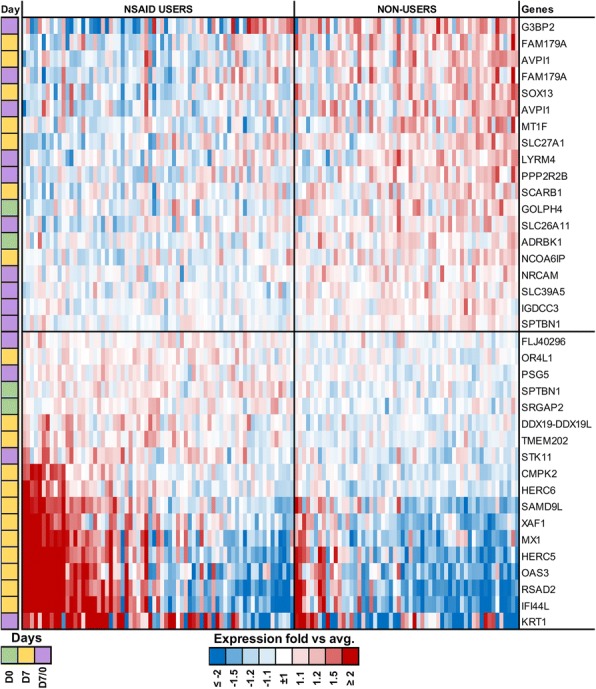
Differences in gene expression profiles in NAIDS users. Gene expression heatmap of known DE genes between individuals on NAIDS or non-users with a False Discovery Rate (FDR) < 10% are displayed. A cut-off of 10% was chosen a priori based on the balance between Type 1 and Type 2 errors as explained further in the methods. The heat-map shows genes that were DE at baseline (D0, day 0, visit 1), 1 week after vaccination (D7, day 7, visit 2) and in response between the two visits (D7/D0). The color in the first column indicates the time point at which the genes were found to be DE between the two groups, whereas the heatmap colors highlight the fold-change. The heatmap is divided into four grids, wherein the bottom left group demonstrates the genes that were significantly upregulated in the NSAIDs-users, and the top right group showcases genes found to be upregulated in the non-users