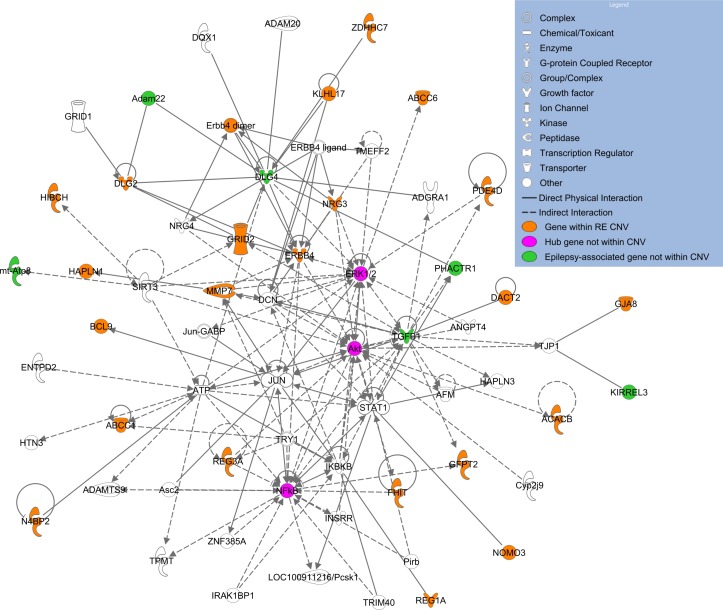
Figure 2.
Network created by Ingenuity Pathway Analysis using the top 36 most highly connected genes disrupted by rolandic epilepsy (RE) CNVs as assessed by the Disease Association Protein-Protein Link Evaluator.36 Orange indicates a gene within a CNV, pink a hub gene, green an epilepsy-associated gene not found within a CNV and white are genes added by Ingenuity Pathway Analysis during network generation due to direct physical or indirect (eg, via activation) interactions with the input list.

