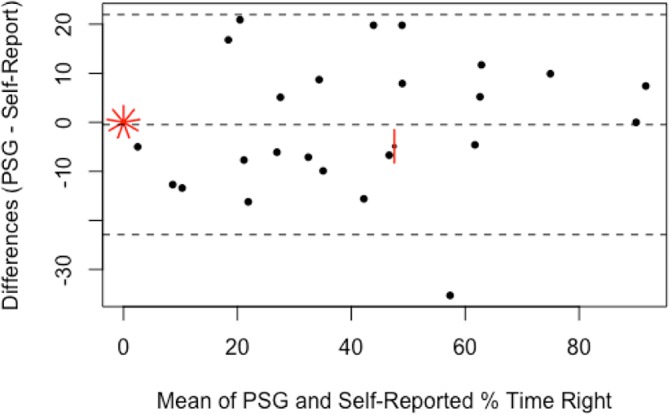
Figure 6.

Bland-Altman plot for percentage of time spent sleeping on the right side; difference between self-reported estimate and PSG-determined values. Broken lines indicate mean difference and upper and lower limits of agreement (95% CI). Each short red line indicates an additional data point at that location (sunflower plot). PSG, polysomnogram.
