Figure 1.

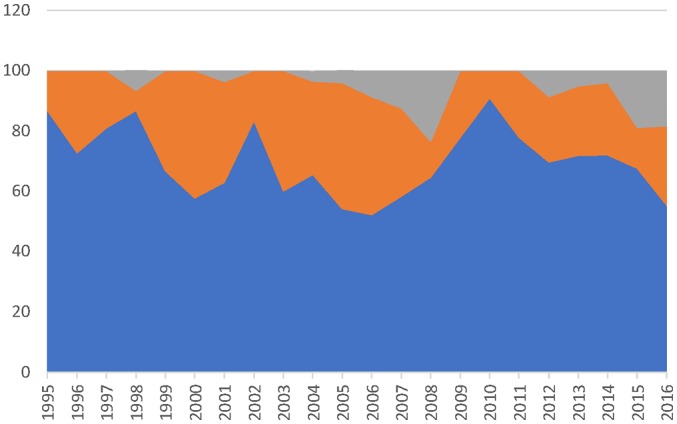
Percent of drugs approved through different pathways. Grey—percent with Notice of Compliance with conditions; orange—percent with priority review; blue—percent with standard review.

Percent of drugs approved through different pathways. Grey—percent with Notice of Compliance with conditions; orange—percent with priority review; blue—percent with standard review.