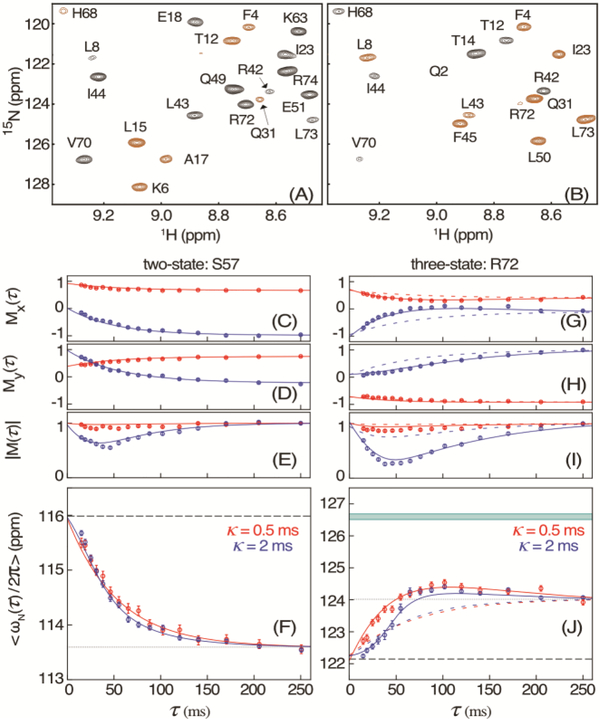
Figure 2.
Measurement of 15N chemical shifts during VA2-ubiquitin folding. (A, B) Small region of the HSQC spectrum, recorded with the scheme of Figure 1 for τ = 10 ms and κ = 2 ms, modulated by (A) cos(ωNκ) and (B) sin(ωNκ). Extension of the 50-ms t1 time domain to 75 ms by the NUS reconstruction program SMILE34 was used to slightly increase both resolution and sensitivity. Negative intensity is shown in brown. For full spectra, see Figure S3. (C) Mx(τ) and (D) My(τ) magnetization of residue S57 after evolution for κ = 0.5 ms (red) and κ = 2 ms (blue), and (E) the corresponding magnitude |M(τ)|, with these values normalized to |M(τ)| = 1 at τ = 248 ms. Solid colored lines correspond to the values predicted for a two-state folding model with ρ = 14.3 s−1 and known chemical shifts14 of the unfolded (F, dashed line) and folded (F, dotted) states at 1 bar. (F) Apparent average chemical shift <ωN/2π> at time τ after the pressure drop. (G-J) Analogous to (C-F) but for residue R72 with solid lines corresponding to a three-state model with ku→i = 13.2 s−1; ku→f = 6.5 s−1; and ki→f = 12.0 s−1, and colored dashed lines for the two-state model. The band at 126.6 ppm in (J) depicts the fitted 15N shift of the intermediate state. The full set of residues is shown in Figure S4. The error bars in (C-E) and (G-I) indicate the RMS noise in the Mx and My spectra, scaled by the normalization factor of |M|. Error bars in (F) and (J) indicate the uncertainty in the average chemical shift derived from the RMS noise in the Mx and My spectra

