Figure 2.
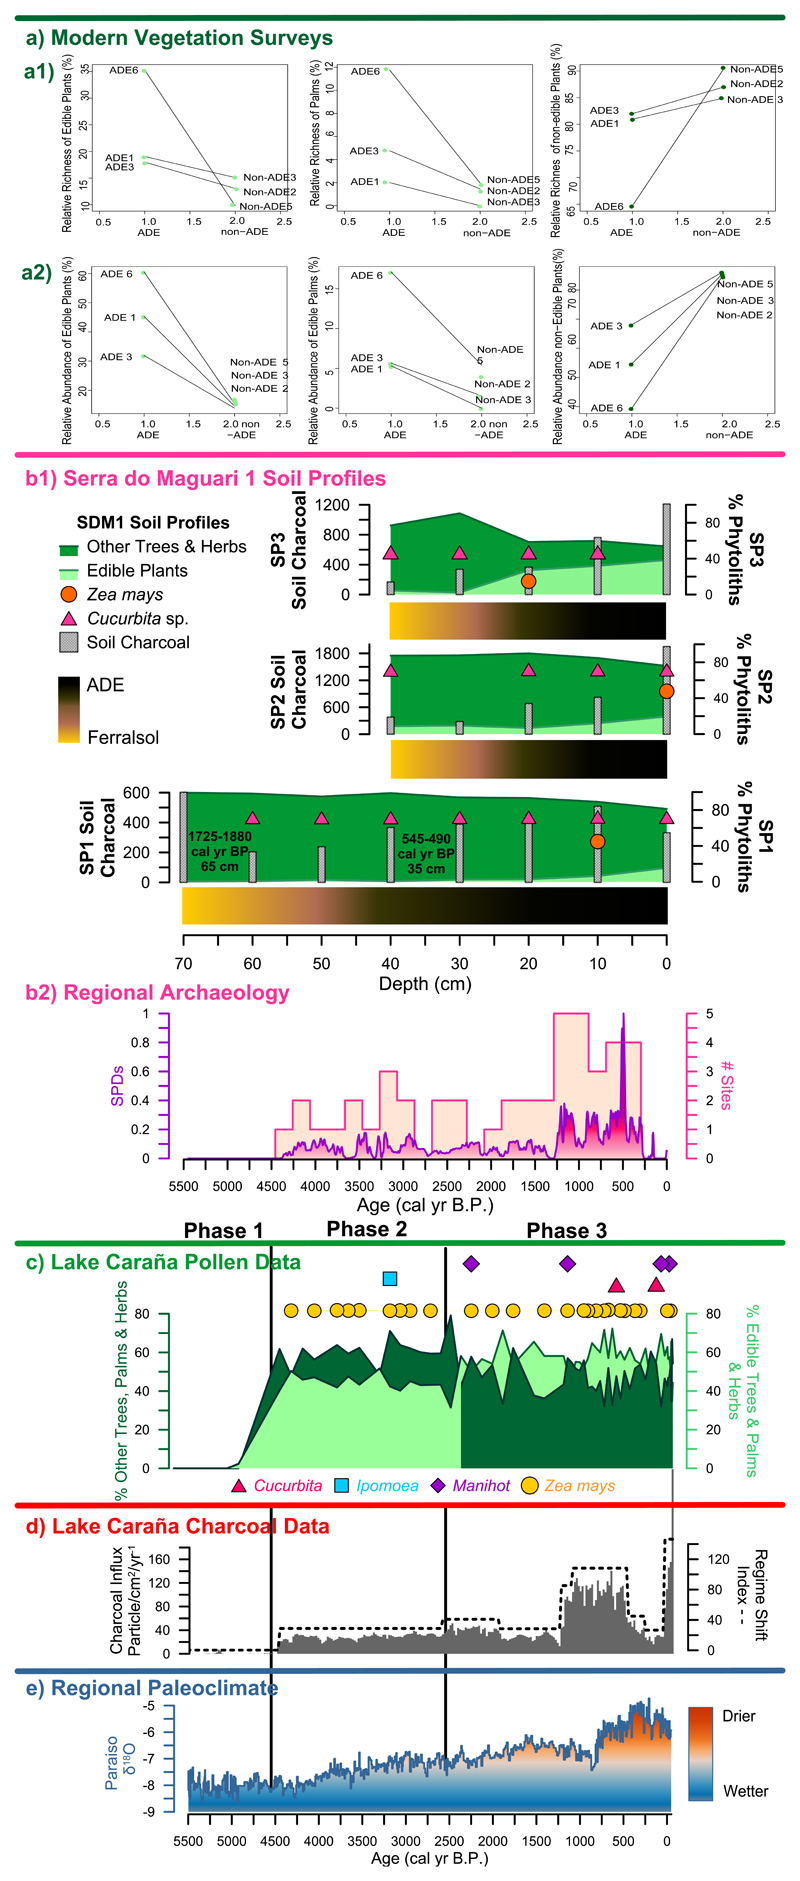
Figure 2 Compiled Data Summary: a, Comparison of relative richness (left) and relative abundance (right) of edible plants (top), edible palms (middle) and other plants from modern vegetation surveys from the three ADE and the three non-ADE sites. b, The phytolith percentage summary diagram of soil profiles (SP), including edible, other trees and herbs, soil charcoal records, and the ADE soil lithology from SDM1 (top). The SPDs from compiled archaeological sites of the Santarém region are also shown (bottom) (Supplementary Table 3). c–d, A summary of the Lake Caranã pollen data (c), the charcoal influx (grey bars) and regime shift index (dashed line) from Lake Caranã (d) and the Paraíso cave speleothem record (e). The age-depth model for Lake Caranã (c–e) is based on calibrated 14C and 210Pb dates (Supplementary Table 2). Data in e from ref. 28.

