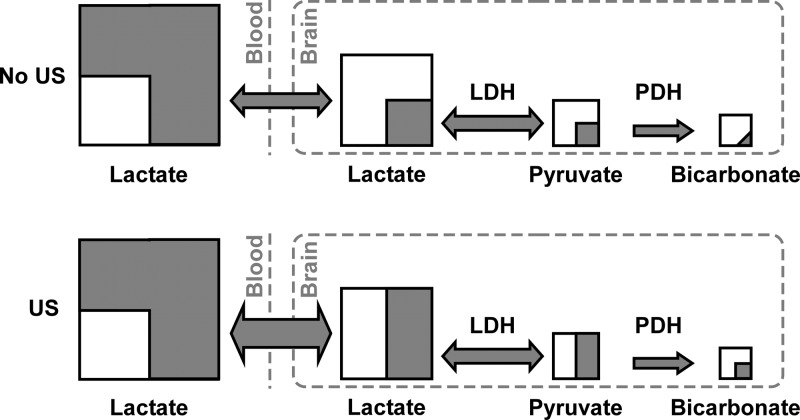
Figure 4.
Schematic representation of the 13C label distribution, across the detected metabolites in the mouse brain exposed to ultrasound (US, bottom) and not exposed to US (top), 75 s after the intravenous injection of [1-13C]lactate. Each square represents a metabolic pool, with the gray part corresponding to the 13C-labeled fraction. The gray arrows represent the 13C label flux between the pools. Note that the relative size of the squares or the gray area within each pool is not scaled to the real pool size ratios or the proportion of the 13C label.

