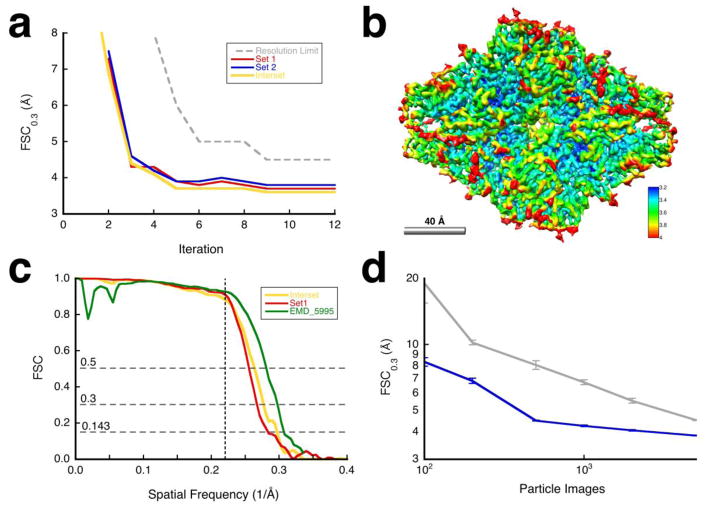
Figure 2.
Results for the β-galactosidase case. (a) Resolution estimates for the reconstructions for the different iterations: halfsets (blue/red) and interset (yellow). The dashed gray curve indicates the resolution limits used for alignment. I aligned the particles with a 60 Å limited reference in the first iteration to find global orientations (borient). During subsequent iterations, I refined the alignment, magnification and defocus for each particle (brefine). D2 symmetry was imposed on alignment and reconstruction. (b) Map sharpened against the carbon electron scattering cross section (bampweigh), colored according to the estimated local resolution (blocres, kernel = 26 Å, FSC0.3). (c) Comparison of the FSC curves for resolution limited alignment (halfset FSC for set 1 in red), independent sets (interset FSC in yellow), and relative to the published map (green) (Bartesaghi et al., 2014). The vertical dashed line indicates the resolution limit used in the final alignment (4.5 Å). (d) Validation by coherence: Resolution estimates with different numbers of randomly selected particles (blue) compared to aligned noise (gray) with error bars for 10 determinations at each point (Heymann, 2015).

