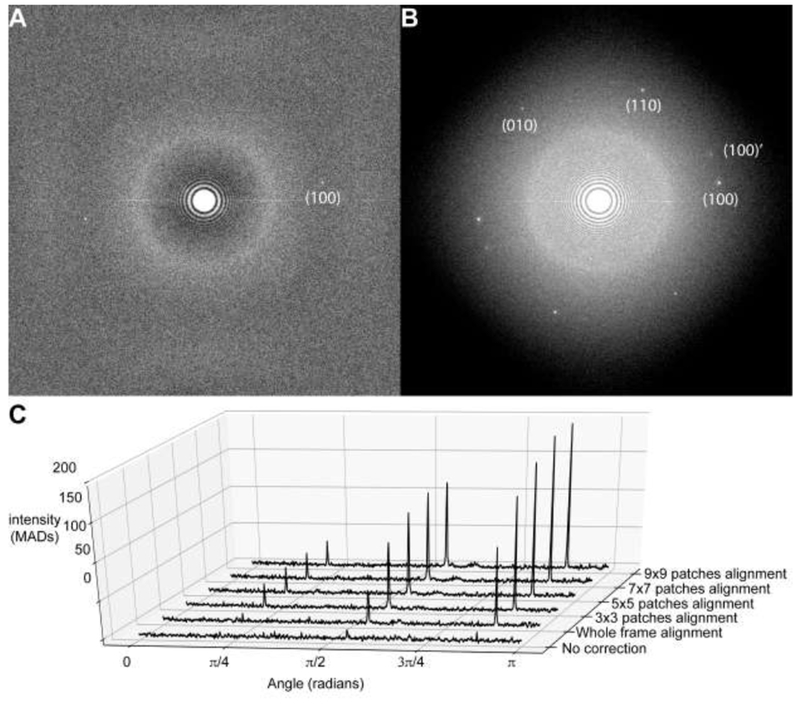
Figure 3. Evaluation of motion correction using GO peak intensities.

Power spectra from the image in Figure 2A before (A.) and after (B.) motion correction. Power spectra were calculated by averaging the periodograms of overlapping 512×512 pixel windows using a script in Python. C. GO peak height increases as the number of local motion patch trajectories calculated by MotionCor2 is increased. To generate 1D radial profiles showing the GO peaks with respect to the background, the aforementioned power spectrum was transformed into polar coordinates by cubic spline interpolation and a radial band of intensities from 2.0Å to 2.2Å was extracted. The maximum intensity component in this band was taken for each angle sampled in the half-circle 0 to π. This was done because the actual spatial frequency of the GO peak deviated from the expected position at 2.13Å, likely due to residual specimen tilt or uncorrected anisotropy in the magnification system (Zhao et al., 2015a). To compare 1D profiles between different motion correction schemes, the intensities in each 1D profile were scaled according to the median absolute deviation (MAD), which is a robust measure of scale. All calculations were performed in python with the scientific computing library scipy, with code available on request.
