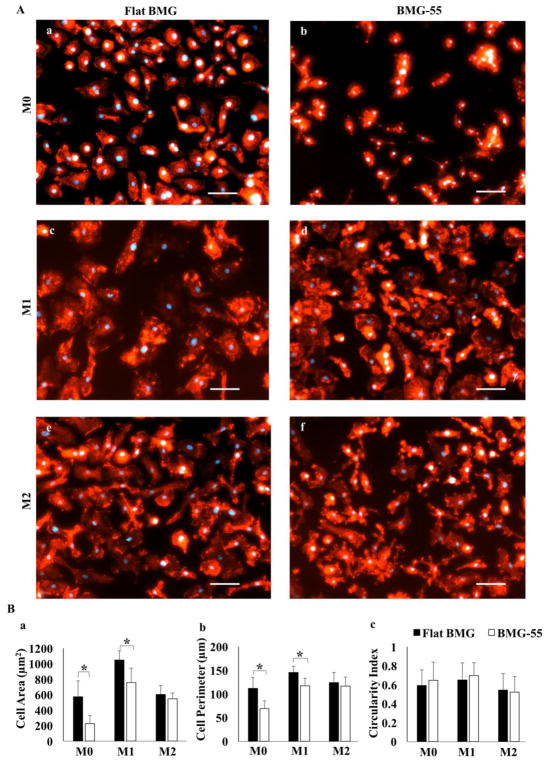
Fig. 3.
Nanopatterning influences cell morphology. Fluorescent images of M0, M1 and M2 cells stained with DAPI (blue) and rhodamine Phalloidin (red) on Flat BMG (A: a, c, e) or BMG-55 (A, b, d, f). Scale bar = 20μm. Original magnification, 200×. (B) Quantification of cell morphology including area (a), perimeter (b), and circularity (c). M0 and M1 cells were smaller on BMG-55. Data represent mean + SD (*p ≤ 0.05), (n=5).

