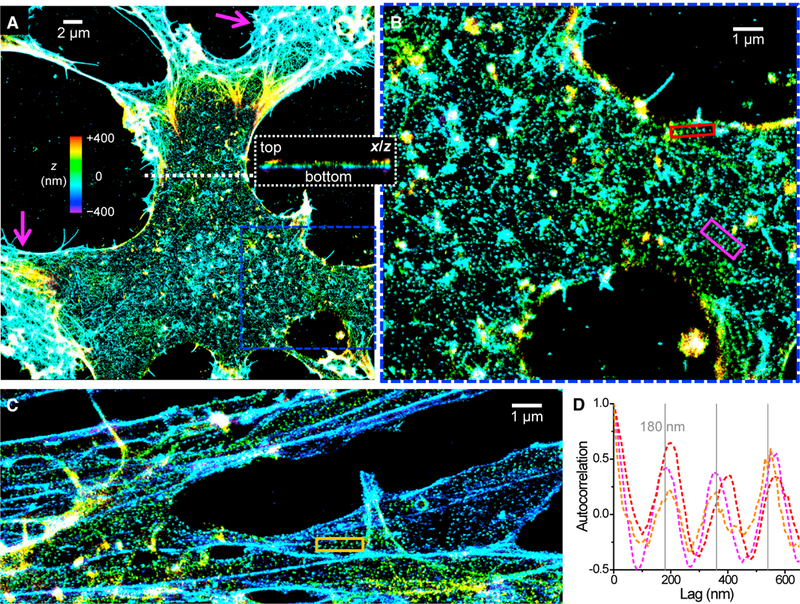
Figure 1. The Actin Cytoskeleton of Undifferentiated NSCs Contains Patches of Locally Periodic Patterns at the Nanoscale.

(A)3D-STORM image of the phalloidin-labeled actin cytoskeleton of an undifferentiated NSC. Color represents height z (color bar; violet denotes closest to the substrate, and red denotes farthest away). Magenta arrows point to protruding edges. Inset: virtual cross-section of the 3D-STORM data in the xz plane along the white dotted line.
(B) Enlargement of the blue box in (A).
(C) Image of NSC processes.
(D) One-dimensional autocorrelation along the red, magenta, and orange boxes in (B) and (C). Gray grid lines mark multiples of 180 nm. See also Figure S1.
