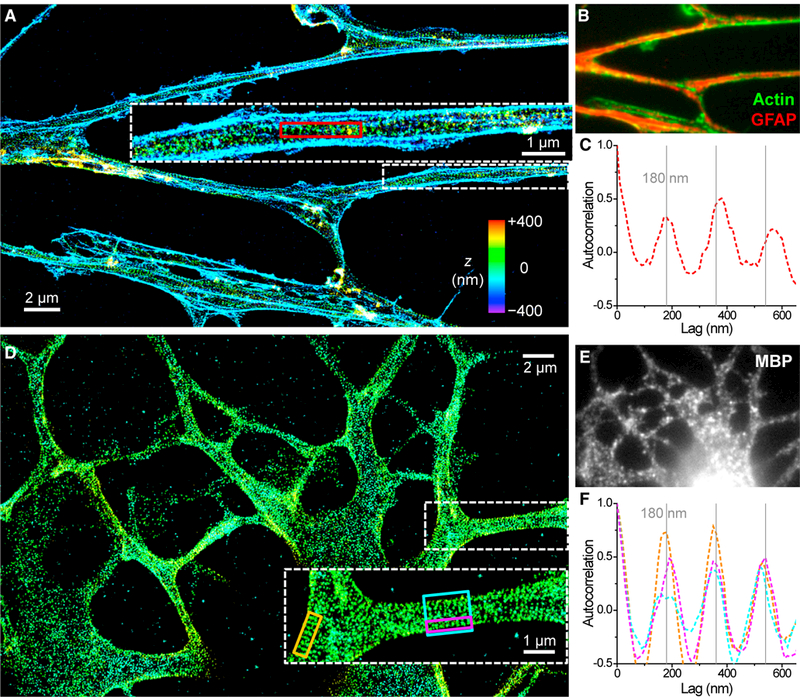
Figure 3. The Membrane Cytoskeletons of NSC-Derived Astrocytes and Oligodendrocytes Are Highly Periodic.

(A) 3D-STORM image of the phalloidin-labeled actin cytoskeleton of an NSC-derived astrocyte. Inset: enlarged image of a process.
(B) Overlapped epifluorescence of actin (green) and GFAP (red).
(C) One-dimensional autocorrelation along the red box in (A). Gray grid lines mark multiples of 180 nm.
(D) 3D-STORM image of immunolabeled adducin for an NSC-derived oligodendrocyte. Inset: enlarged image of a process.
(E) MBP staining of the cell.
(F) One-dimensional autocorrelations along the orange, magenta, and cyan boxes in (D). Gray grid lines mark multiples of 180 nm. See also Figures S2 and S3.
