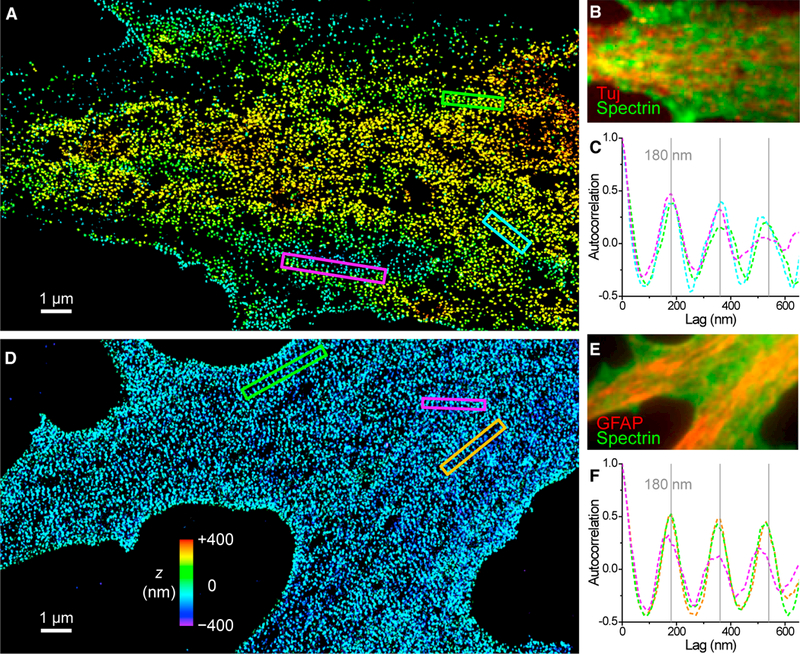
Figure 4. Collages of 1D Periodic Cytoskeletal Motifs on the 2D Membranes of Developing NSCs.

(A) 3D-STORM image of βII spectrin (C terminus) at the dorsal (top) membrane of an NSC in transition to a neuron.
(B) Overlapped epifluorescence of the neuron marker Tuj (neuron-specific class III β-tubulin; red) and βII spectrin (green) of the cell.
(C) One-dimensional autocorrelations along the green, magenta, and cyan boxes in (A). Gray grid lines mark multiples of 180 nm.
(D) 3D-STORM image of βII spectrin (C terminus) at the ventral (bottom) membrane of an NSC in transition to an astrocyte.
(E) GFAP (red) and βII spectrin (green) staining of the cell.
(F) One-dimensional autocorrelations along the green, magenta, and orange boxes in (D). Gray grid lines mark multiples of 180 nm. See also Figure S4.
