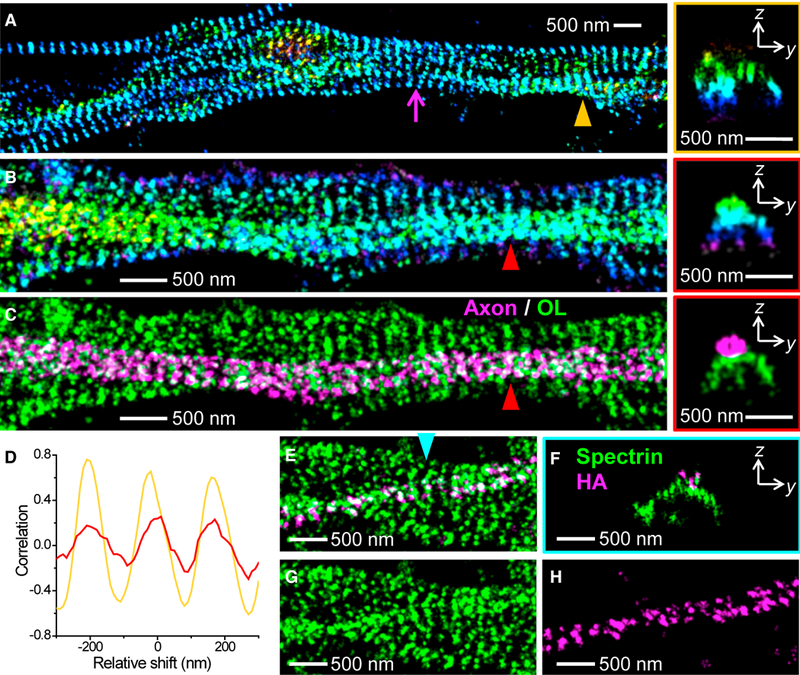
Figure 5. Alignment of the 1D Periodic Membrane Cytoskeletons in Contacting Cells.

(A) 3D-STORM image of βII spectrin (C terminus) of contacting axons of primary hippocampal neurons. The magenta arrow points to a lattice mismatch (dislocation). Right: a virtual cross-section in the yz plane for the contacting 1D cytoskeletons pointed to by the orange triangle.
(B) 3D-STORM image of βII spectrin (C terminus) of an axon on top of a process of an oligodendrocyte (see MBP staining in Figure S5), in an NSC-derived mixed culture of neurons and glial cells. Right: a virtual cross-section in the yz plane for the contacting 1D cytoskeletons pointed to by the red triangle.
(C) Separation of the axon (magenta) and oligodendrocyte (green) membrane cytoskeletons based on the 3D-STORM image in (B).
(D) One-dimensional spatial correlations between the spectrin cytoskeletons of two abutting cells for a region surrounding the axon-axon contact site indicated by the orange triangle in (A) (orange curve) and for a region surrounding the axon-oligodendrocyte contact site indicated by the red triangle in (C) (red curve) for varying relative shifts in the horizontal direction.
(E) Two-color 3D-STORM image of immunolabeled C terminus of βII spectrin (green, labeled by AF647) and overexpressed HA-tagged C terminus of βII spectrin (magenta, labeled by CF568) in a primary hippocampal culture.
(F) A virtual cross-section in the yz plane for the contacting 1D cytoskeletons pointed to by the cyan triangle.
(G and H) The two color channels of (E) separated into spectrin (G) and HA-tag (H). See also Figure S5.
