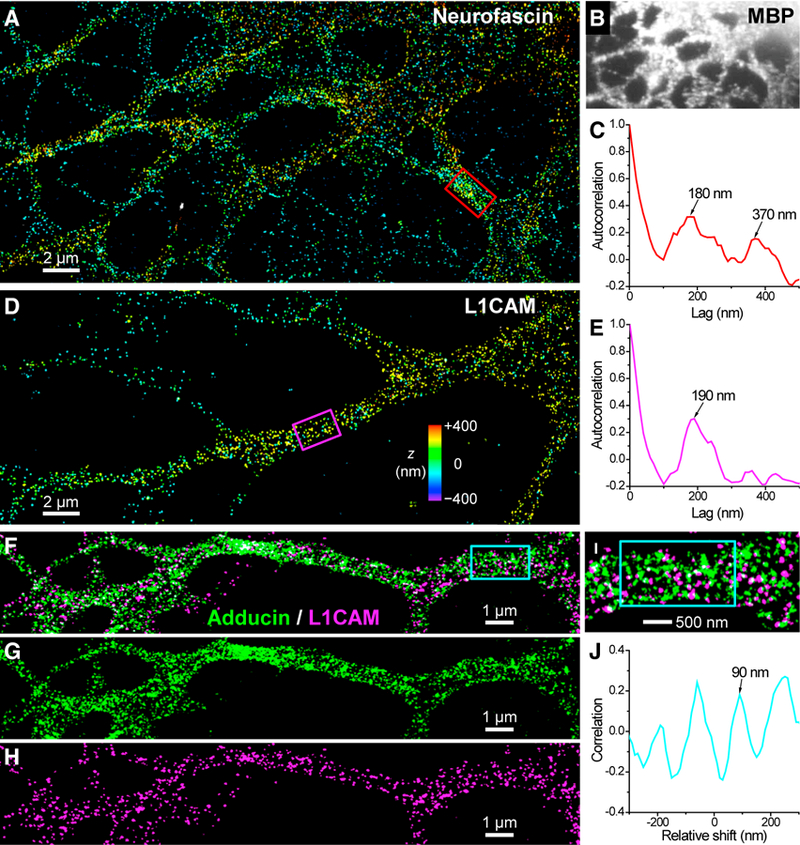
Figure 6. Cell Adhesion Molecules Adopt a Semi-periodic 1D Ultrastructure in NSC- Derived Cells.

(A) 3D-STORM image of neurofascin for an NSC-derived oligodendrocyte.
(B) MBP staining of the cell.
(C) One-dimensional autocorrelation along the red box in (A).
(D) 3D-STORM image of L1CAM for an NSC-derived neuron.
(E) One-dimensional autocorrelation along the magenta box in (D).
(F) Two-color STORM image of adducin (green, labeled by CF568) and L1CAM (magenta, labeled by AF647) in an NSC-derived oligodendrocyte.
(G and H) The two color channels of (F) separated into adducin (G) and L1CAM (H).
(I) A close-up of (F).
(J) One-dimensional spatial correlation between the two color channels for varying relative shifts along the cyan box in (F) and (I). See also Figure S6.
