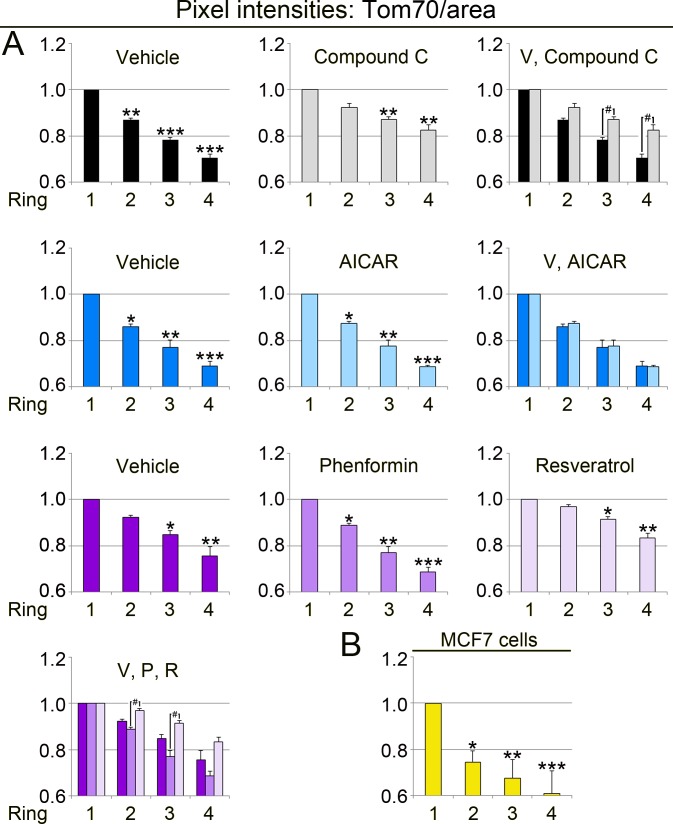
Figure 8. Quantitative image analyses demonstrate that the abundance of Tom70/mitochondrial area relies on the organelle position.
(A) LLC-PK1 cells were examined for the subcellular distribution of Tom70. The pixel intensity for Tom70/mitochondrial area was calculated for each ring, as described for Fig. 6. Y-axes depict the ratio Tom70/mitochondrial area. For each data set, results were normalized to ring 1. One-way ANOVA combined with Bonferroni post-hoc analysis uncovered significant differences between ring 1 and ring 2, 3 or 4; *, p < 0.05; **, p < 0.01; ***, p < 0.001. Rings at the same position were further assessed in control and drug-treated cells. Top row: Student’s t-test compared rings for cells incubated with vehicle or compound C. Compound C increased significantly the signals for Tom70/area in rings 3 and 4; #, p < 0.05. Bottom row: Simultaneous comparison of all pairs by One-way ANOVA combined with Bonferroni correction revealed significant differences between phenformin (P) and resveratrol (R) for rings 2 and 3; #, p < 0.05. (B) In MCF7 cells, Tom70 abundance per mitochondrial area also depends on organelle location. Statistical assessment was performed by One-way ANOVA followed by Bonferroni post-hoc analysis. Compared to ring 1, values for Tom70/mitochondrial area were significantly lower in ring 2, 3 or 4; *, p < 0.05; **, p < 0.01; ***, p < 0.001. Note that for LLC-PK1 and MCF7 cells the ring-specific changes in the MitoTracker/area (Fig. 7) and Tom70/area (Fig. 8) quotients are not identical.

