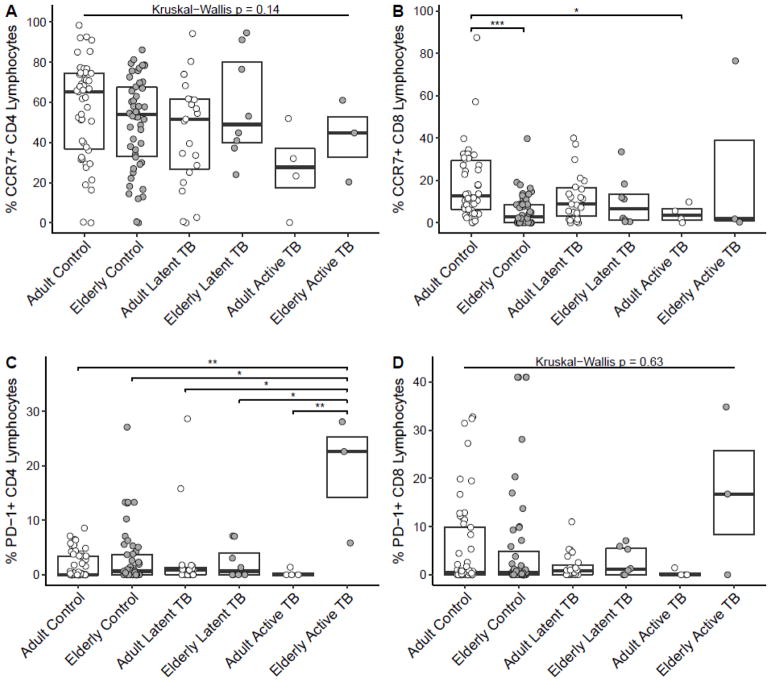
Figure 2. Global T cell CCR7 phenotype is not altered by age in those with LTBI or active TB but PD-1 phenotype may be increased in elderly with active TB.
Percent of CD4+ (A) and CD8+ (B) lymphocytes expressing CCR7. Percent of CD4+ (C) and CD8+ (D) lymphocytes expressing PD-1. For all comparisons between age groups not displayed, there were no significant differences (p>0.05). Boxplots are medians with interquartile ranges. Total subjects for each panel are 135 (A), 134 (B), 143 (C) and 142 (D). Other Kruskal-Wallis p values were p=0.0001 (B) and p=0.03 (C). * p<0.05, ** p<0.01, ***p<0.001 by Dunn’s test.

