
Fig. 4.
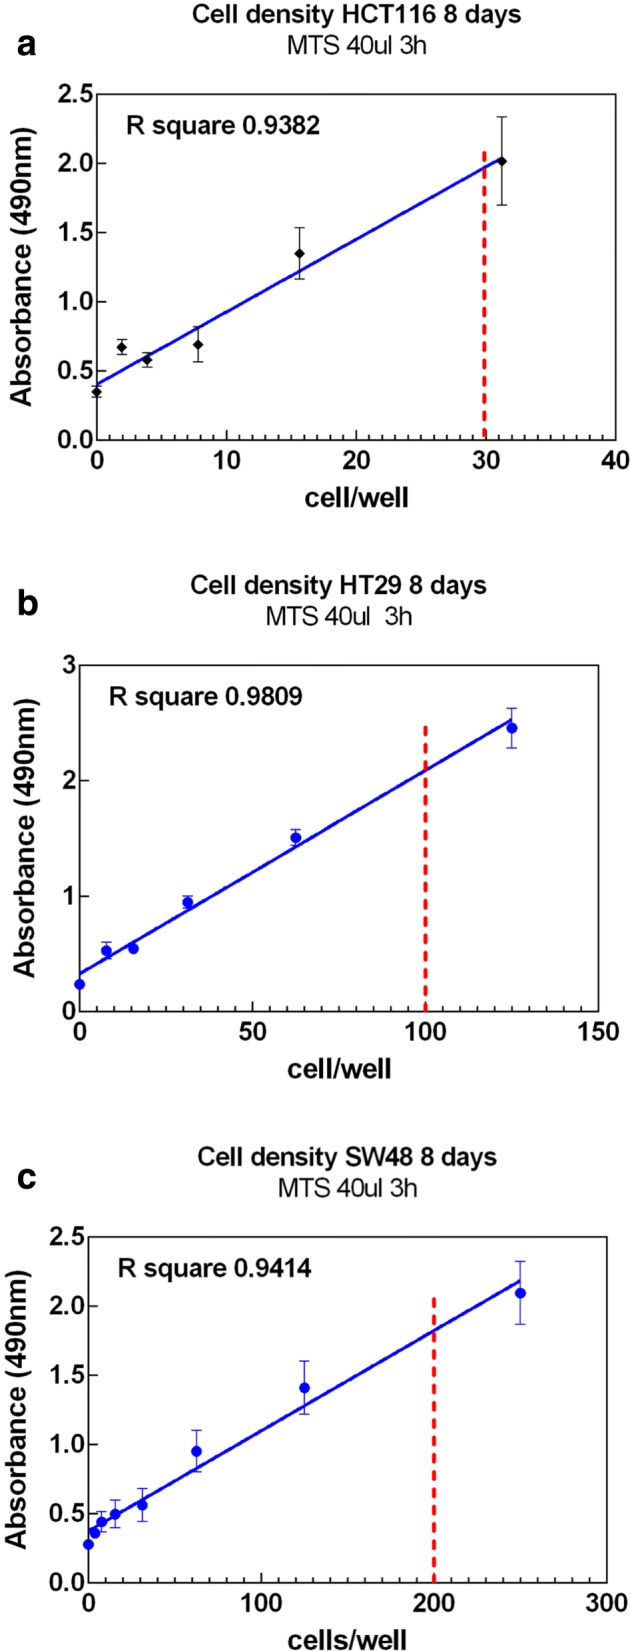
Linear regression fit for the cell density of three cell lines. The red dashed line indicates the number of cells per well used to culture the cells
Official websites use .gov
A
.gov website belongs to an official
government organization in the United States.
Secure .gov websites use HTTPS
A lock (
) or https:// means you've safely
connected to the .gov website. Share sensitive
information only on official, secure websites.
Linear regression fit for the cell density of three cell lines. The red dashed line indicates the number of cells per well used to culture the cells