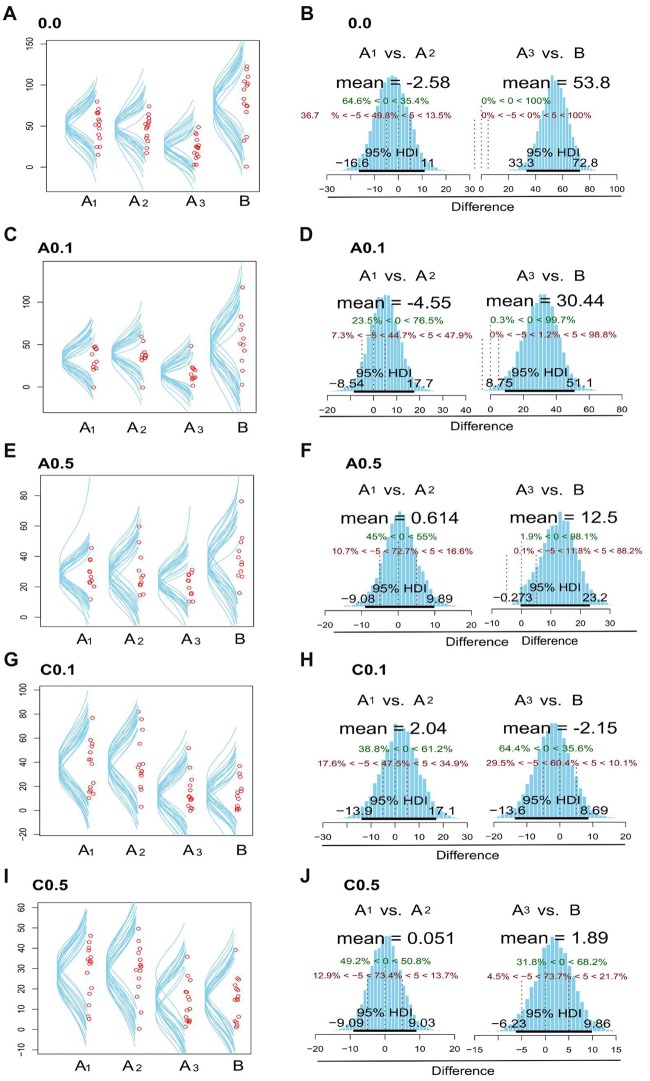
Figure 2.
Plots zebrafish exploration of objects A1, A2, A3 and B. Fish were observed for 15 min and the time spent near the objects were considered as exploration. The left side column (A,C,E,G,I) shows the dispersion of median values for exploration time in each object, both in memorization and in discrimination phases, for the 0.0, A0.1, A0.5, C0.1 and C0.5 groups. The right column (B,D,F,H,J) exhibits posterior distribution of the Bayesian analysis: comparison between the exploration time of objects A1 vs. A2 and A3 vs. B for the five groups tested. Green dashed lines (central dashed line) indicate the comparison value = 0 and red dashed lines (lateral dashed lines) indicate the Region of Practical Equivalence (ROPE) ±5. 95% highest density interval (HDI) is marked by the black bar on the floor of the distribution. For further details and statistical analyses, see the “Results” section.

