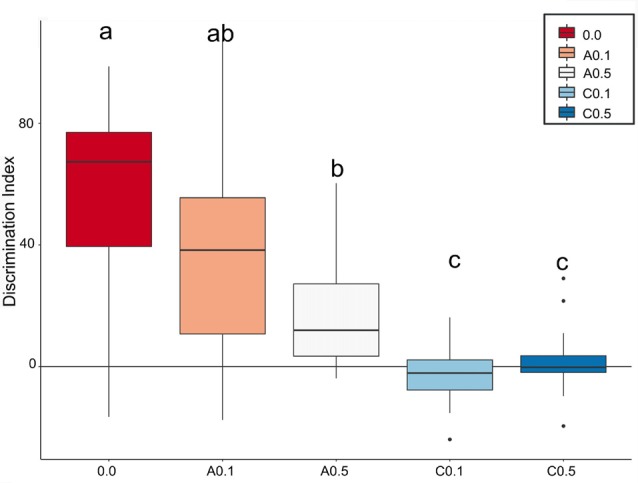
Figure 3.

Index box plots represent the relative median values of discrimination index (Di = B − A3) for the five groups tested in comparison with a theoretical mean of 0. Groups C0.1 and C0.5 together showed the lowest values of discrimination, while the A0.1 presented discrimination similar to control group. Different letters represent statistic difference between groups. Isolated dots correspond to outliers’ values. For further details and statistical analyses, see the “Statistical Analysis” section.
