
Figure 1.
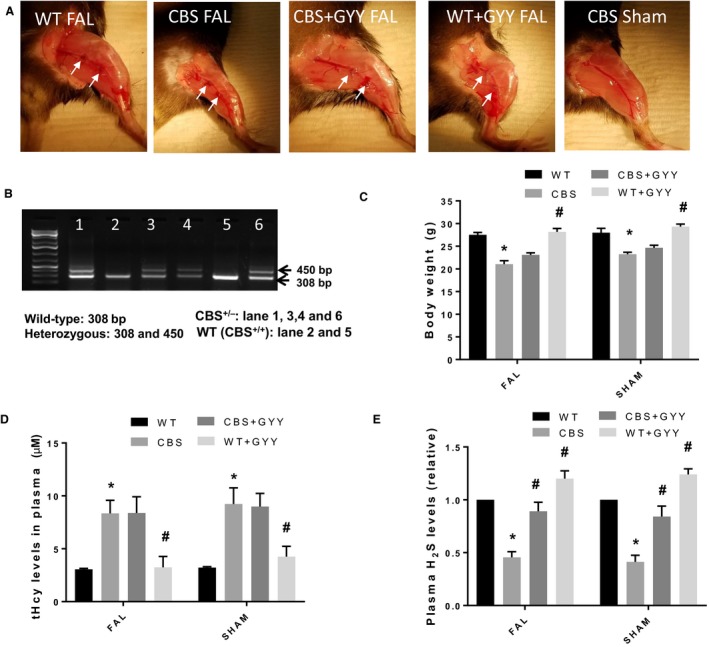
Phenotypic and genotypic correlations between cystathionine‐β‐synthase (CBS +/−) and wild‐type (WT) mice groups. (A) Hind limb images after 21 days of GYY4137 treatments. (B) Genotyping for CBS +/− and WT mice. (C) Body weight measurements of experimental mice. (D) tHcy measurements from the plasma of experimental mice. (E) H2S measurements from the plasma of experimental mice. Data are shown as Mean ± SEM and mice number (n) = 4, statistical difference *P < 0.05 versus WT and # P < 0.05 versus CBS. (tHcy = total homocysteine, FAL = femoral artery ligation).