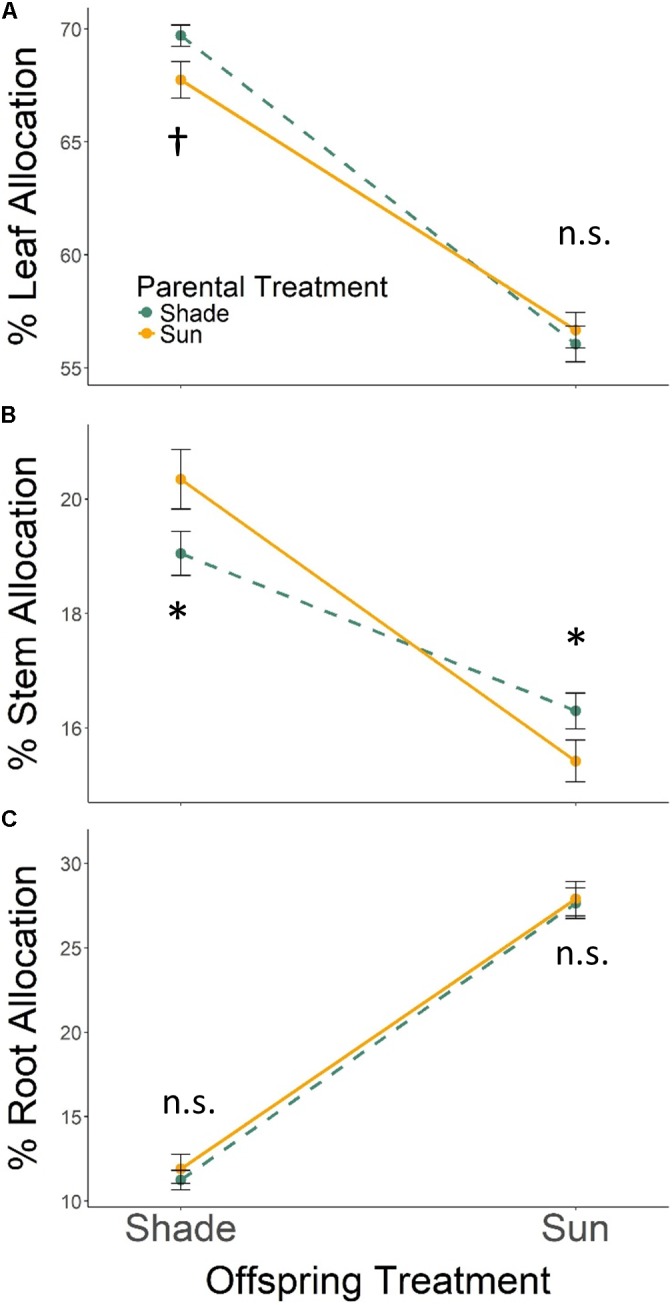
FIGURE 2.

Means ± SE shown (N = 184) for (A) % leaf, (B) % stem, and (C) % root biomass allocation for offspring of Parental Shade (dashed green line) and Parental Sun (solid yellow line) plants that were grown either in Offspring Shade or Offspring Sun treatments. Results of significant tests for the effect of parental shade versus sun in each offspring treatment are shown, based on separate within-treatment ANOVAs (†p < 0.10, ∗p < 0.05, n.s. p > 0.1, see section “Materials and Methods” for details).
