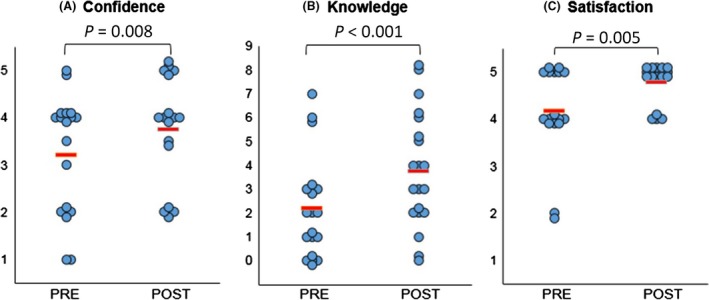
Figure 2.

Statistically significant changes were observed in confidence (A), knowledge (B) and satisfaction (C) amongst participants comparing responses before (“Pre”) and after (“Post”) their consultation. Note for a 1 = Not at all confident – 5 = Very confident; for b each point represents a point in knowledge, as marked according to the correct name of primary diagnosis, correctly identified keywords and correct use of diagrams; for c1 = Very dissatisfied – 5 = Very satisfied. The red lines indicate average score. Reprint with permission from Biglino et al.9
