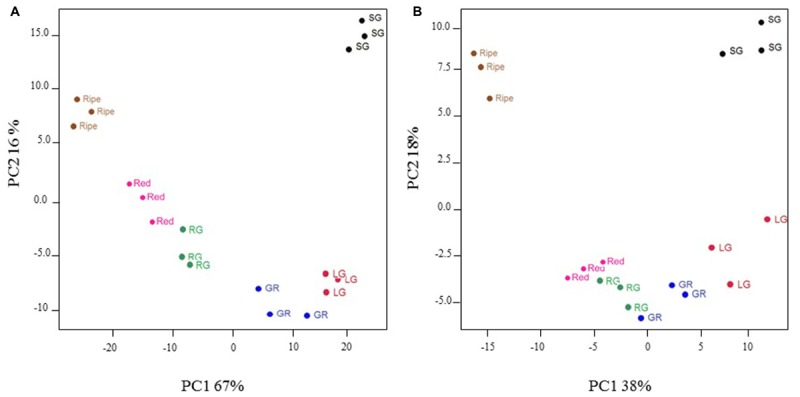
FIGURE 3.

Principal components analysis of significantly differentially expressed transcripts (A) and selected metabolites (B) in developing blackcurrant fruit. Fruit were collected from three individual plants at the small green (SG), large green (LG), green–red (GR), red–green (RG), red and ripe fruit stages.
