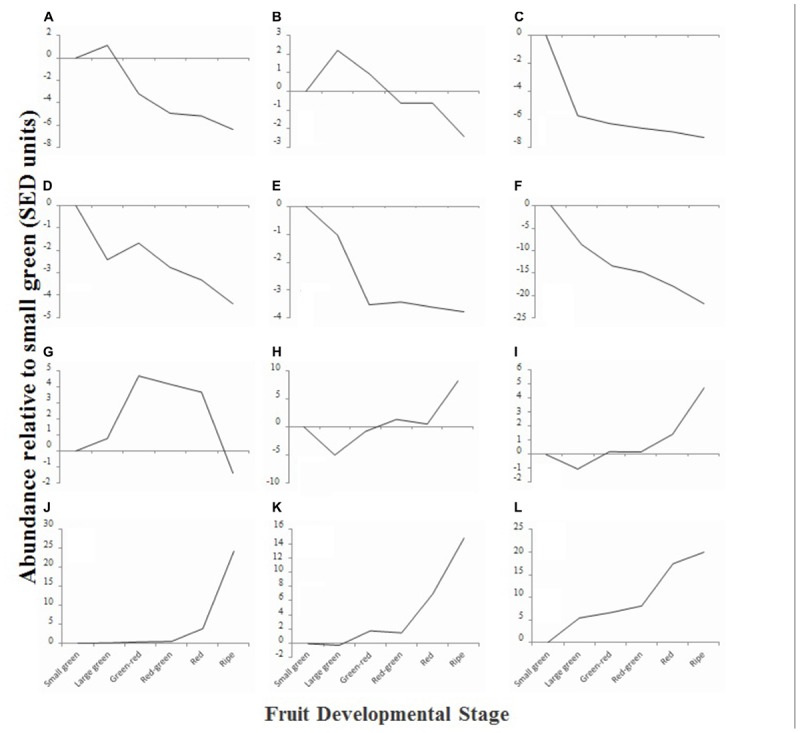
FIGURE 4.

Relative average abundance of metabolite clusters identified by hierarchical cluster analysis at six stages of blackcurrant fruit ripening. Clusters were identified at an initial cut-off of 96% similarity with additional manual adjustment based on visual assessment of similarity dendrogram and are identified in the text as labeled (A–L). Data are represented as the average change of abundance of compounds present in the cluster relative to average abundance in small green fruit. Data were normalized based on standard errors of difference (SED) as described in materials and methods.
