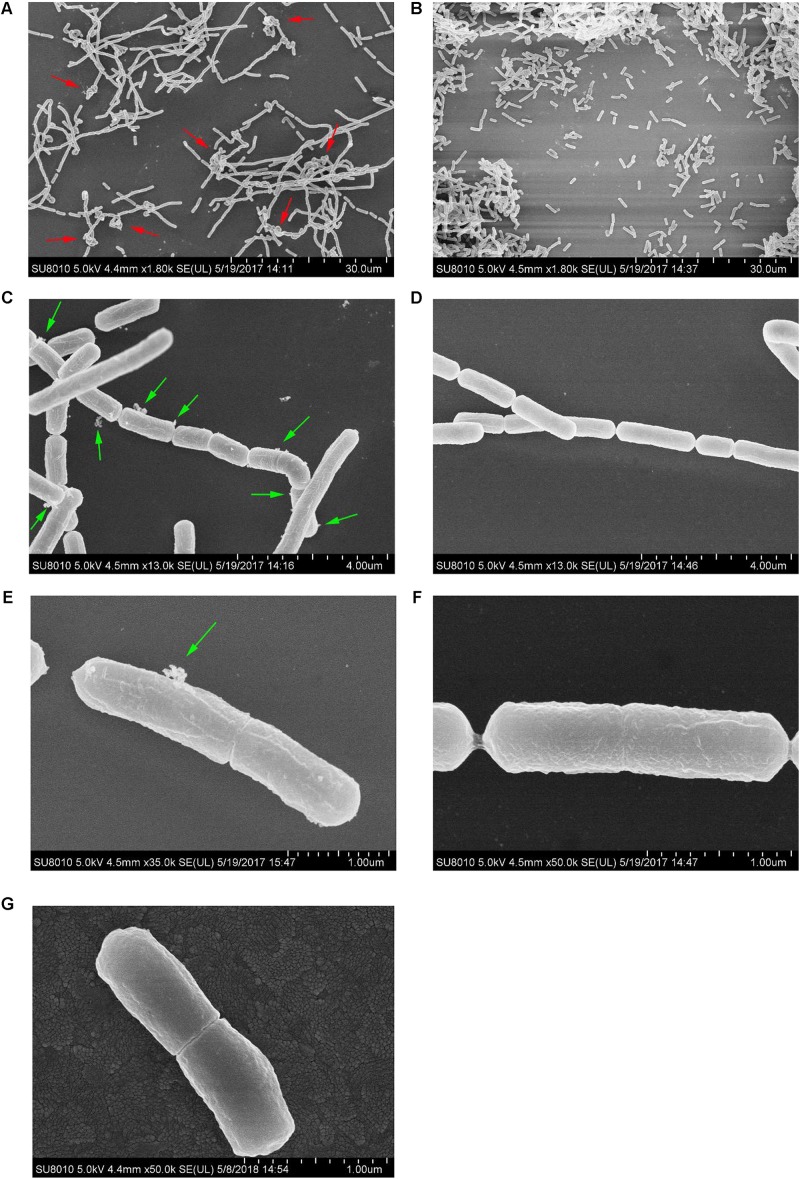
FIGURE 3.
Field-emission scanning electron microscopy examination of cells of L. paracasei L9 treated with 0.2% Ox-bile. For three groups, the left row (A,C,E) was bacteria from CDM+Bile and the right (B,D,F) was from CDMM+Bile. (G) Shows bacteria from CDM without bile salt. The twist structure (red arrows) and MVs (green arrows) are indicated.

