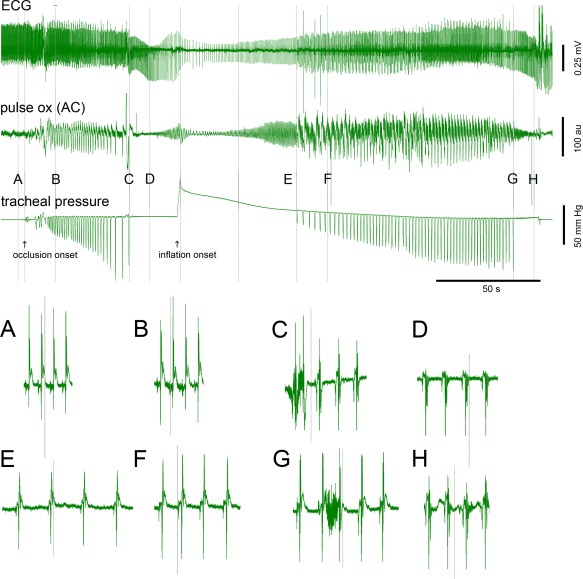
Figure 1.

Illustration of overall experiment, sequence of milestones, and ECG detail for resuscitation by bolus lung inflation after respiratory arrest.
Top illustrates the overall experiment and sequence of milestones. ECG (top sweep), photoplethysmography (middle sweep), and tracheal pressure (bottom sweep) for a controlled airway occlusion followed by bolus lung inflation. The onset of airway occlusion and the onset of lung inflation are marked by arrows below the tracheal pressure trace. Bottom A–H illustrate details of ECG morphology and heart rate at the points labeled above the tracheal pressure trace and marked with vertical lines. Note the development of bradyarrhythmia and significant ST segment changes from A to D (A: pre‐occlusion baseline, B: 15 seconds post occlusion onset, C: point of respiratory arrest, and D: 10 seconds post RA). Occlusion onset, inflation peak pressure, and the midpoint between the inflation peak and the first inspiratory attempt are marked with unlabeled vertical lines. Note 1) the recovery of cardiac performance as evidenced by the improvements in ECG amplitude and ST morphology (E, F) and rate (from the minimum rate shortly after inflation onset), and 2) improvements in systemic oxygen delivery as evidenced by the photoplethysmography leading up to point E. Calibrations are shown on the figure.
Labeled points (A–H) correspond to the times used for summary plots in Figure 3.
