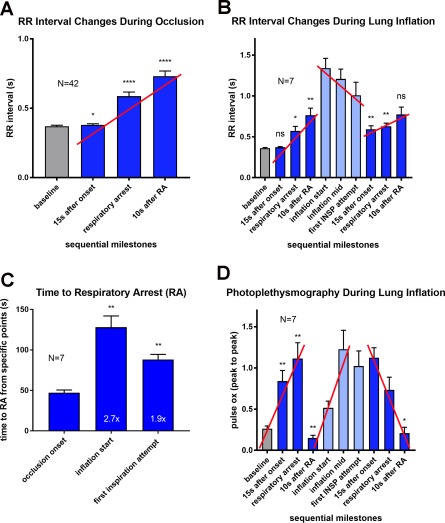
Figure 3.

Summary of ECG and photoplethysmography changes during airway occlusion and resuscitation by bolus lung inflation.
A. Changes in RR interval during airway occlusion up to and beyond the point of respiratory arrest in all animals. Time points selected for comparison to prior studies (eg, Nakase et al.3 and to simplify analyses of variance. Trendlines based on these selected time points approximate trendlines derived from the complete data set (difference in slopes < 20%, R2 > 0.9; red trendlines in all panels indicate significant trends: P < .0001). B. Changes in RR interval duration during occlusion and bolus lung inflation with oxygen. For the first 4 bars, F(1.331, 7.987) = 17.9, P = .0020, P < .13, .03, .01 Dunnett's multiple comparison; test for trend P < .0001). During lung inflation, F(2.312, 13.87) = 10.06, P = .0015, P < .01, .01, and .06 for comparisons with the inflation start (Dunnett's multiple comparisons). C. Comparison of times to respiratory arrest (RA) from onset of occlusion to first arrest, onset of lung inflation to second arrest, and first inspiratory attempt after lung inflation to second arrest. D. Photoplethysmography changes during occlusion and bolus lung inflation. For the first 4 bars, F(1.122, 6.735) = 26.49, P = .0013, P < .01, .01, .01, Dunnett's multiple comparison; test for trend showing impact of large negative intrathoracic pressures on peak‐to‐peak photoplethysmogram amplitude P < .0001). In the center, light blue bars highlight the large photoplethysmogram amplitudes in the absence of any effort to inspire indicating a basis for resuscitation when lung inflation is the only manipulation (F [1.77, 10.62] = 6.37, P = .0172). During lung inflation, photoplethysmogram remains elevated until after respiratory arrest due to the added impact of inspiratory attempts on blood flow in the periphery (F[2.133, 12.8] = 10.12, P = .0021, P = .92, .45, and .03 for comparisons with the inflation start).
