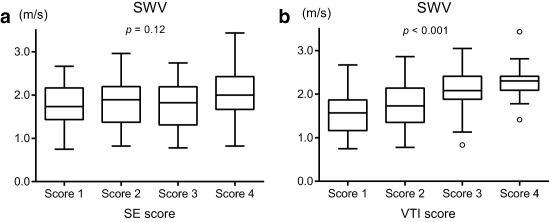
Figure 3.

A. Shear wave velocities (SWVs) of each SE score. There were no significant differences among the four scores (P = .12). Kruskal–Wallis Test.
B. SWVs of each VTI score. There were significant differences among the four scores (P < .001). Kruskal–Wallis Test.
