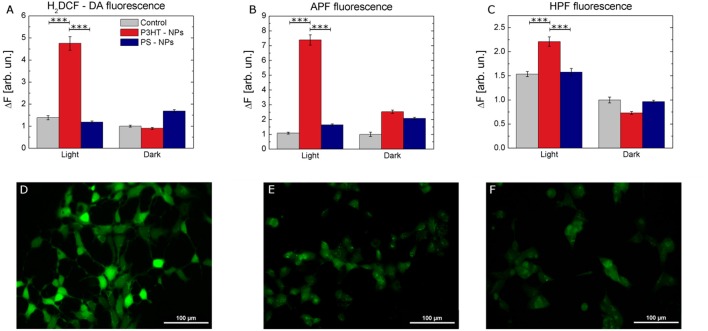
Figure 3.
Intracellular ROS production by P3HT NPs optical excitation. (A–C) Fluorescence variation intensity measured in control (gray), P3HT NPs–treated (red), and PS NPs treated (blue) cells, due to ROS sensitive intracellular probes (H2DCF-DA, A, APF, B, and HPF, C). Data are represented as mean ± SE values, over statistical samples of n = 34 (control light), n = 81 (control dark), n = 49 (P3HT NPs light), n = 102 (P3HT NPs dark), n = 109 (PS NPs light), n = 105 (PS NPs dark) for H2DCF-DA; n = 57 (control light), n = 26 (control dark), n = 90 (P3HT NPs light), n = 63 (P3HT NPs dark), n = 70 (PS NPs light), n = 69 (PS NPs dark) for APF; n = 110 (control light), n = 118 (control dark), n = 137 (P3HT NPs light), n = 120 (P3HT NPs dark), n = 147 (PS NPs light), n = 120 (PS NPs dark) for HPF, where n represents the number of cells over three different experiments for each condition. Statistical significance has been evaluated by one-way ANOVA analysis followed by post-hoc Tukey test. P-values of the test are assigned as follows: *** for p < 0.001. Statistically non-significant results are not marked in the figures. All details of statistical analysis are reported in the SI section. (D-F) Representative images of ROS-induced fluorescence response of H2DCF-DA (D), APF (E), HPF (F) in P3HT NPs treated cells. Fluorescence images have been acquired after carrying out the protocol for NPs excitation, as described in detail in the Methods section. Scale bar, 100 μm.

