Figure 4.
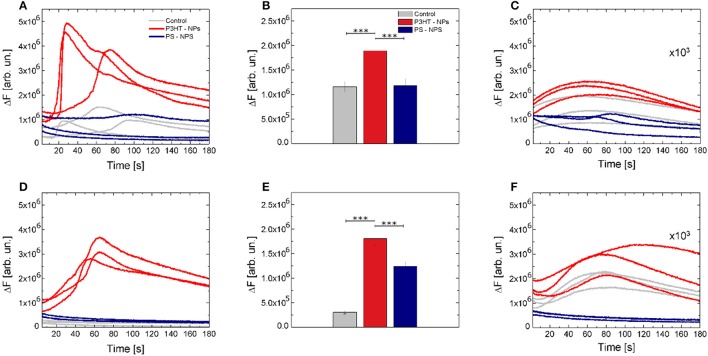
Optical modulation of intracellular Ca2+ dynamics. (A) Representative Ca2+ dynamics recorded in control (gray solid lines), P3HT NPs treated cells (red solid lines) and PS NPs treated cells (blue solid lines). (B) Fluorescence relative increase of the Fluo-4 calcium indicator. Data are shown as mean ± SE, over statistical sample sets of n = 71, n = 68, n = 55 cells (for control, P3HT NPs and PS-NPs samples, three experiments for each condition, respectively). Statistical analysis has been carried out by one-way ANOVA, followed by post-hoc Tukey test. P-values of the test are assigned as follows: *** for p < 0.001. Statistically non-significant results are not marked in the figure. See SI section for all details of statistical analysis. (C) Effect of the specific ROS inhibitor (NAC) on Ca2+ dynamics. Data have been multiplied by a 103 factor, to make them visible over the same y-axis scale used in (A). (D–F) Representative Ca2+ dynamics, Fluo-4 fluorescence relative increase and effect of NAC ROS inhibitor, in absence of extracellular Ca2+ ions. In panel E, data are shown as mean ± SE, over statistical sample sets of n = 29, n = 60, n = 37 cells (for control, P3HT NPs and PS-NPs samples, respectively).

