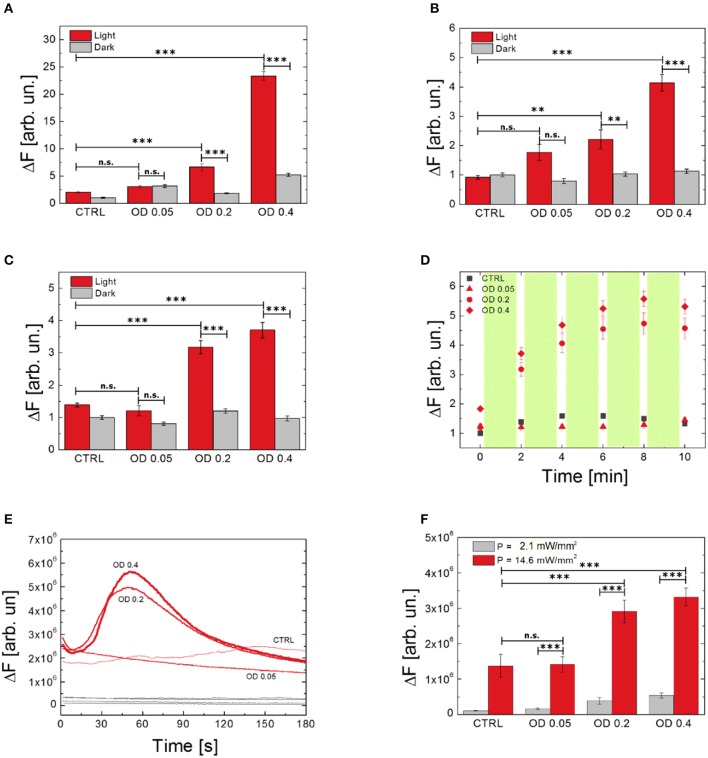
Figure 5.
Effect of P3HT NPs dispersion concentration on ROS generation by using different probes (A, H2DCF-DA; B, HPF; C,D, APF) and Ca2+ modulation (E,F). Data report the mean values over populations, three experiments for each condition, of NH2DCF−DA_Light_OD0.4 = 66, NH2DCF−DA_Dark_OD0.4 = 40, NH2DCF−DA_Light_OD0.2 = 46, NH2DCF−DA_Dark_OD0.2 = 40, NH2DCF−DA_Light_OD0.05 = 48, NH2DCF−DA_Dark_OD0.05 = 30, NH2DCF−DA_Light_untreated = 42, NH2DCF−DA_Dark_untreated = 30, NHPF_Light_OD0.4 = 48, NHPF_Dark_OD0.4 = 46, NHPF_Light_OD0.2 = 48, NHPF_Dark_OD0.2 = 43, NHPF_Light_OD0.05 = 54, NHPF_Dark_OD0.05 = 52, NHPF_Light_untreated = 47, NHPF_Dark_untreated = 39, NAPF_Light_OD0.4 = 56, NAPF_Dark_OD0.4 = 56, NAPF_Light_OD0.2 = 69, NAPF_Dark_OD0.2 = 69, NAPF_Light_OD0.05 = 48, NAPF_Dark_OD0.05 = 48, NAPF_Light_untreated = 42, NAPF_Dark_untreated = 42, NFLUO−4_OD0.4 = 43, NFLUO−4_OD0.2 = 51, NFLUO−4_OD0.05 = 60, NFLUO−4_untreated = 56. (D) Shows the effect on ROS production of repeated light stimulation events, each one of 2 min overall duration, as evidenced by using the APF probe. Statistical analysis has been carried out by one-way ANOVA, followed by post-hoc Tukey test. P-values of the test are assigned as follows: ***for p < 0.001, **for p < 0.005. Statistically non-significant results are marked as n.s. in the figures. See SI section for all details of statistical analysis.

