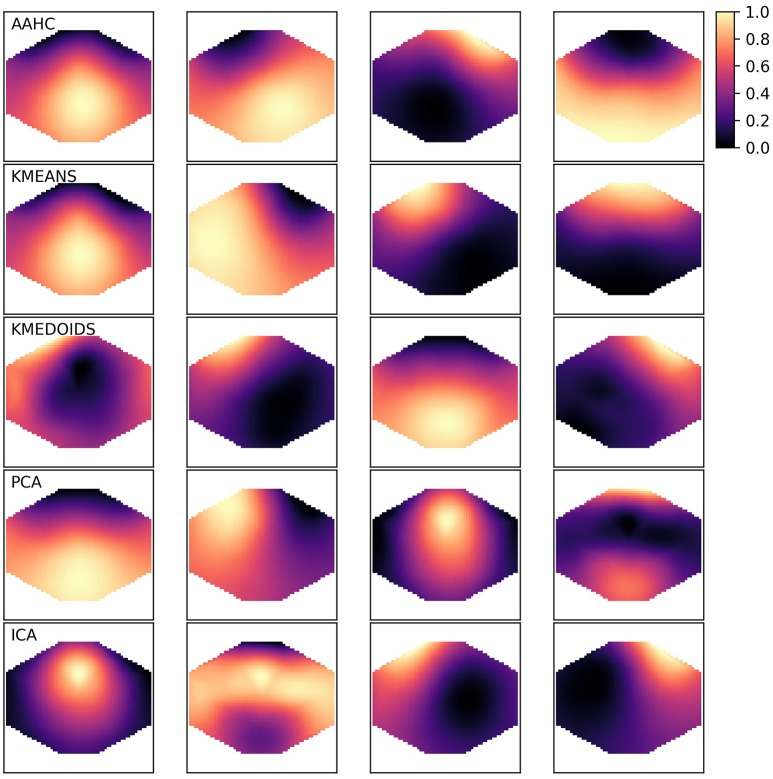
Figure 1.
Exemplary microstate maps from a resting state EEG recording of 120 s duration from a single healthy subject. The four microstates produced by each clustering method are shown row-wise and the algorithms are abbreviated in the upper left corner. The color map shown in the upper right corner is valid for all algorithms. As microstate maps are normalized and neither absolute amplitudes nor polarity is used in further analyses, values can be represented in the [0, 1] range.

