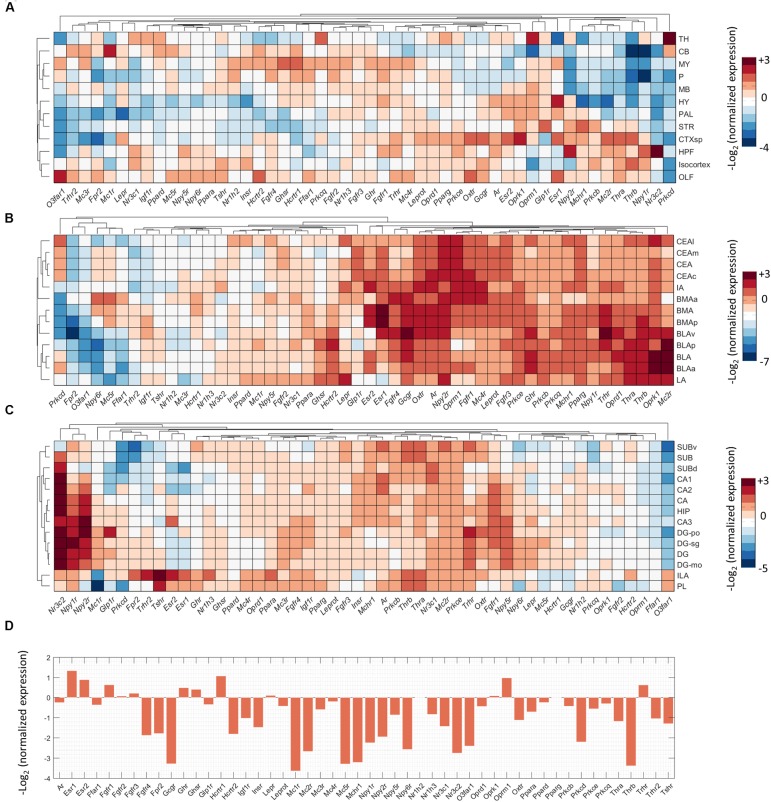
FIGURE 3.
Expression summary of metabolic receptor genes in fear-related brain regions. Clustered normalized expression energies across: (A) 12 crude brain regions, (B) amygdala, (C) hippocampus and medial prefrontal cortex, and (D) periaqueductal gray. We calculated the normalized expression as the average expression of each gene in a brain region of interest divided by the average expression of that gene in the whole brain.

