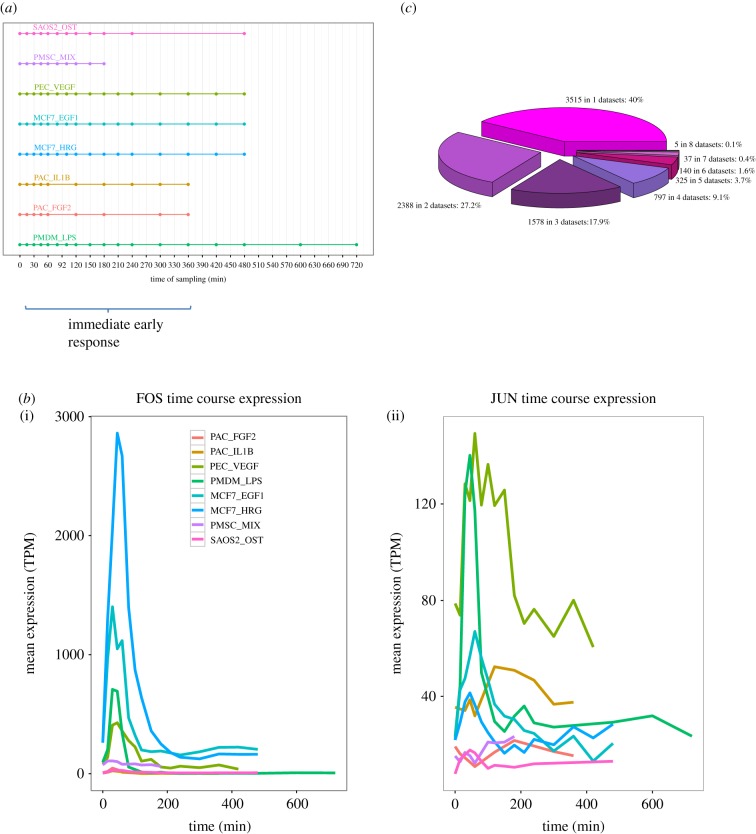
Figure 1.
Time course datasets demonstrating the immediate early response. (a) Schematic of the eight time course datasets considered. Horizontal lines indicate the time span and symbols show the sampling times. Time zero corresponds to inactivated or quiescent cells in all cases. (b) The time course expression profile of FOS (i) and JUN (ii) in all eight datasets. Cage cluster expression (mean TPM of three replicates) is plotted against time. (c) The extent to which the classification of a TSS as a peak is unique to one dataset (3515 TSS) or shared between two or more datasets.

