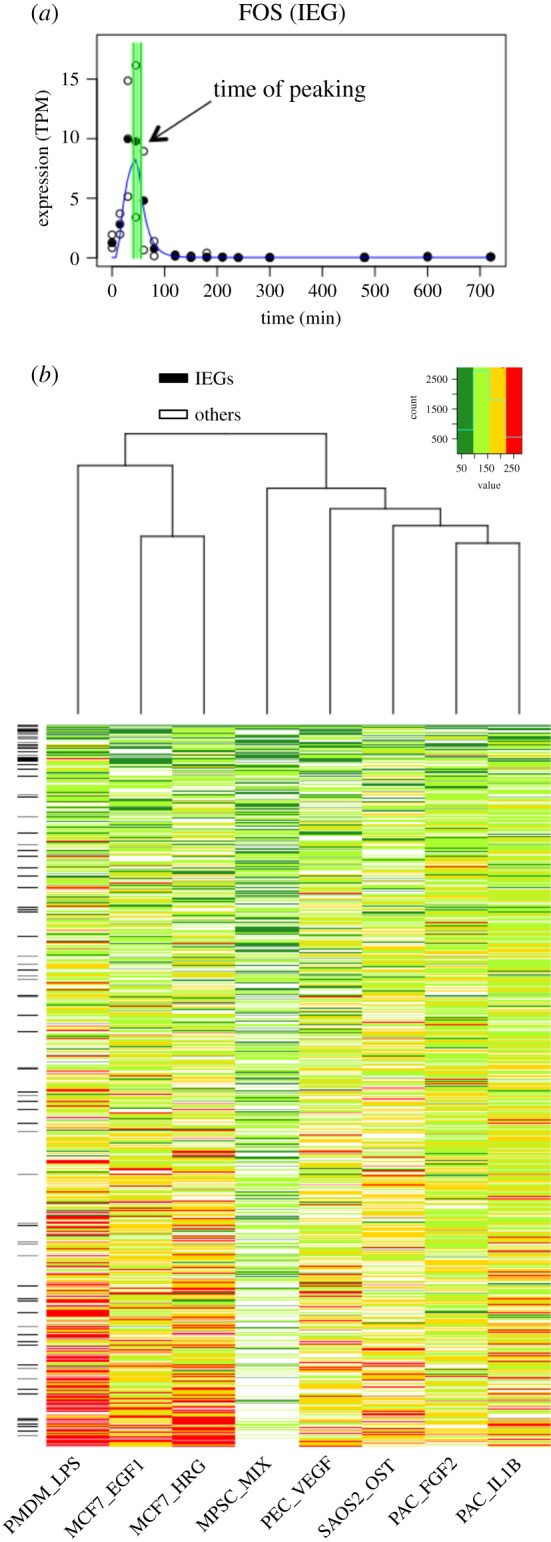
Figure 2.

Broad trends in peak expression times across datasets. (a) Identification of the peak time parameter (tp) of FOS estimated from the PMDM_LPS time series (filled symbols indicate the median TPM; unfilled symbols are individual replicates; green lines represent tp and one standard deviation above and below). (b) Heatmap of the times of peak TSS expression (tp) for TSSs in the permissive set for all datasets. Heatmap colours reflect the tp for each CAGE TSS (within 100 min: dark green; 100–150 min: light green; 150–200 min: yellow; beyond 200 min: red). Known IEGs are indicated on the left by black cells.
