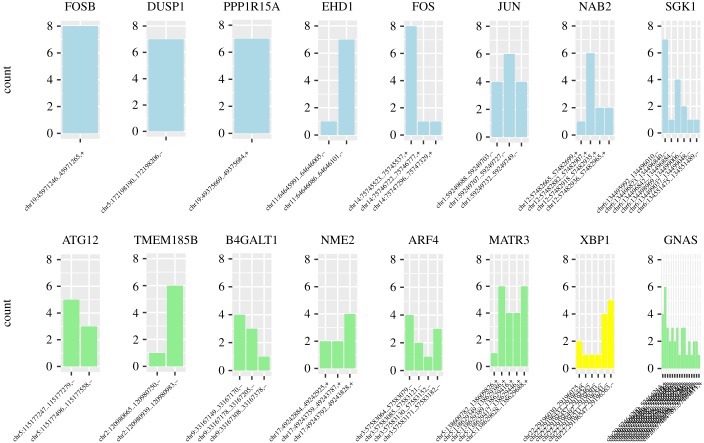
Figure 3.
Promoter usage across time series datasets. For representative genes, bar charts show the number of datasets where each TSS peaks to illustrate the diversity of TSS usage and commonality of the peaking response. Known IEGS are shown in blue, TFs in yellow and other genes in green. FOSB has a single TSS that peaks in eight datasets, JUN has three TSS each peaking in four or more datasets and XBP1 has six TSS that peak in between one and six datasets.

