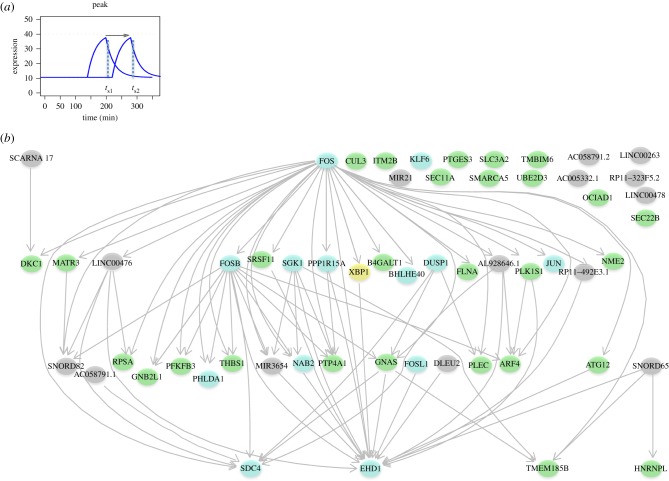
Figure 4.
Conserved activation network. (a) Schematic profiles of two peaking genes, with temporal precedence indicated by the arrow. (b) Conserved temporal precedence between IEGs (light blue nodes), TFs (yellow nodes) ncRNA (grey nodes) and other protein-coding genes (green nodes) is shown by directed edges. A subset of IEGs in this network are also TFs (FOS, KLF6, FOSB, BHLHE40, JUN and FOSL1).

