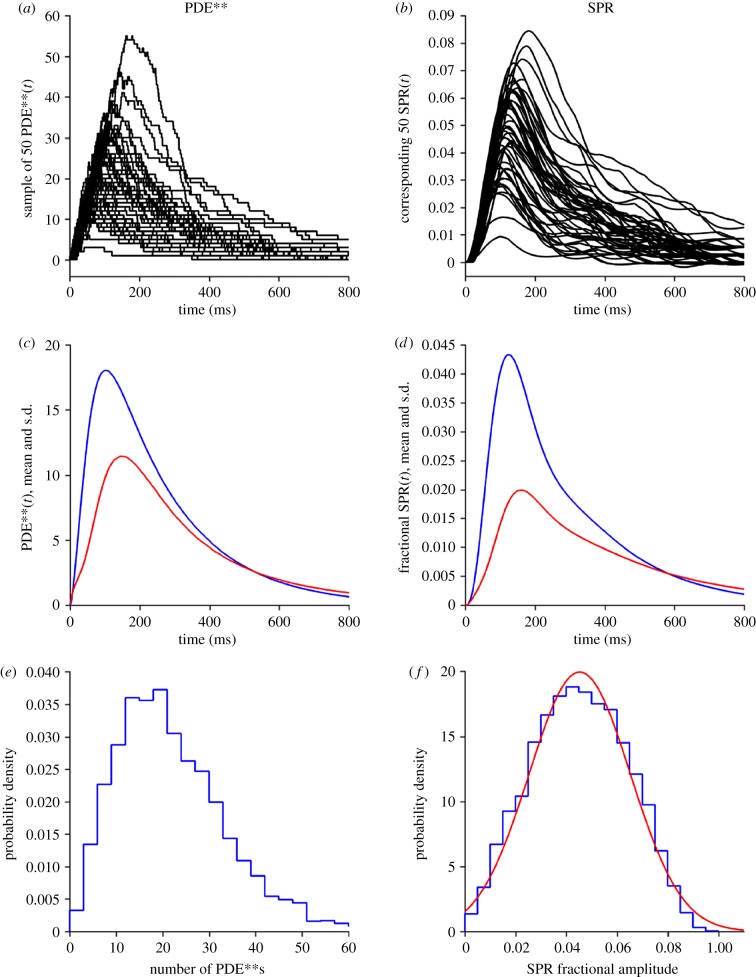
Figure 4.
Single-photon PDE** kinetics and electrical response. Results for simulation of 4000 trials with the standard parameters listed in table 1. Column (a,c,e) shows PDE**; column (b,d,f) shows electrical response (normalized, as a fraction of the circulating dark current). Row (a,b) shows a sample of 50 consecutive simulations. Row (c,d) shows the ensemble means (blue) and s.d. (red). Row (e,f) shows the probability density histograms (blue); the red curve in panel (f) is a Gaussian with mean of 0.0453 and an s.d. of 0.0200.

