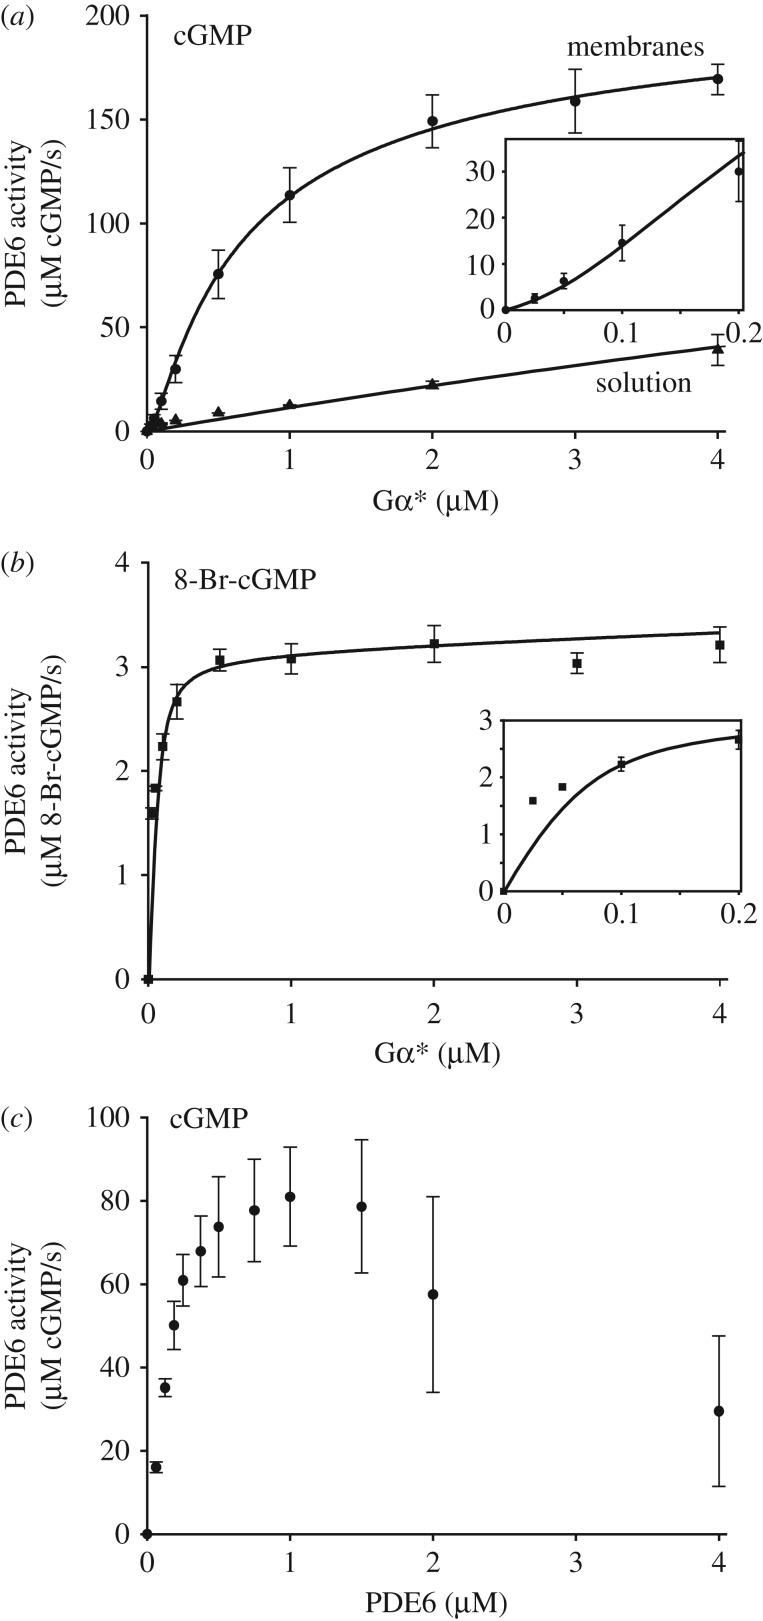
Figure 1.
Activity of PDE6 stimulated by GTPγS-activated G protein α-subunit (Gα*). (a) Activity of PDE6 (0.1 µM) measured as the rate of cGMP hydrolysis at increasing Gα* concentrations in solution (triangles) or in the presence of disc membranes (circles; 10 µM rhodopsin). Note that for PDE6 in solution, the data are limited to the initial part of the binding curve. (b) PDE6 (0.1 µM) activity of same batches of samples measured in the presence of disc membranes (10 µM rhodopsin) with 8-Br-cGMP. Insets in (a) and (b) depict the lower concentration range measured in the presence of membranes on expanded scales. Note that no basal PDE6 activity (0 µM Gα*) was detectable in (a) and (b). Note also the different y-scales. (c) PDE6 activity as a function of PDE6 concentration at fixed Gα* (0.25 µM) in the presence of disc membranes (10 µM rhodopsin). All data points represent the average of three experiments with error bars depicting standard errors. Solid lines represent best fits to the data points (see the text for details). Note that the relatively large error bars in (a) and (c) are due to averaging measurements with different preparations (Gα*, PDE6 and membranes) and different combinations of those preparations. The data points for individual titration curves show little scatter (see electronic supplementary material, figure S2) and the main characteristics of the curves (sigmoidal shape in (a) and biphasic curve in (c)) were well established in each titration experiment.

