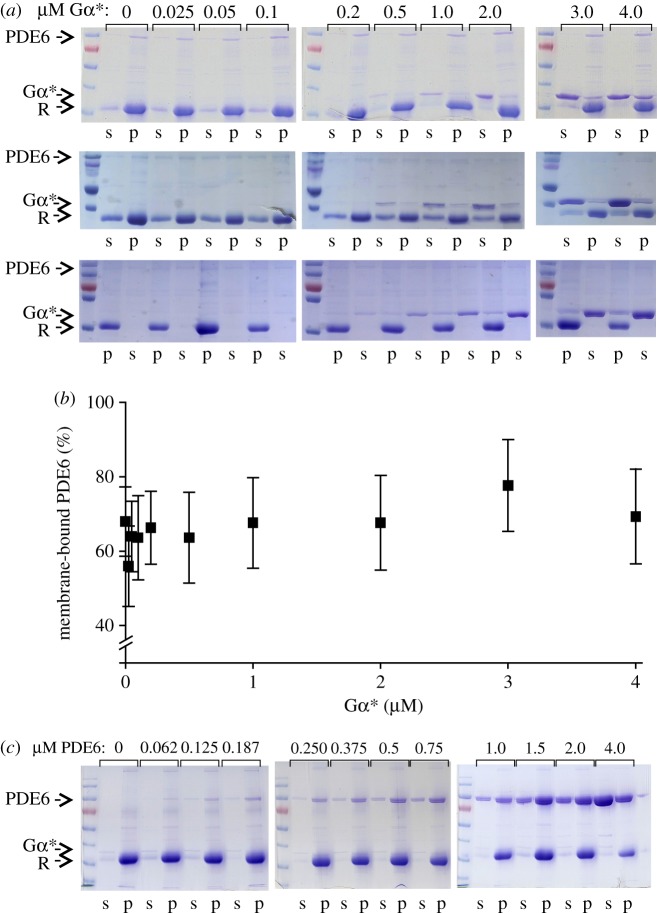
Figure 2.
Membrane binding of PDE6. (a) Coomassie-stained gels for the three sets of samples used in the PDE6 activity measurements (figure 1a; electronic supplementary material, figure S1b). Titration of PDE6 (0.1 µM) with Gα* in the presence of disc membranes (10 µM rhodopsin; R). Samples were partitioned into soluble (s) and pellet (p) fractions by centrifugation. (b) Densitometric quantification of membrane-bound PDE6 using the gels shown in (a). PDE6 (66 ± 3%) was membrane bound on average. Note that, due to the high membrane concentration used in these experiments, the amount of PDE6 bound to the membrane did not depend significantly on the Gα* concentration, which is consistent with a previous study [33]. (c) Coomassie-stained gels of a representative set of samples used in the PDE6 activity measurements (figure 1c). Titration of Gα* (0.25 µM) with PDE6 in the presence of disc membranes (10 µM rhodopsin; R). Samples were partitioned into soluble (s) and pellet (p) fractions by centrifugation.

