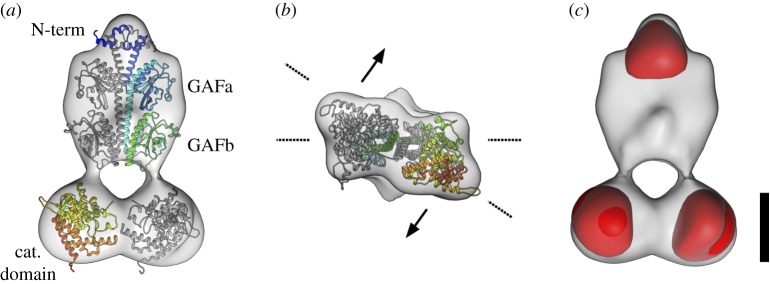
Figure 4.
Cryo-EM structural characterization of PDE6. (a) Front view of the electron density map of the final tPDE6 cryo-EM structure (grey), with a rigid-body docked homology model of bovine PDE6. The α-chain is depicted in a rainbow gradient from N-terminus to C-terminus, while the β chain is presented in grey. (b) View from the catalytic domain of tPDE6. The catalytic domain is tilted out of plane with respect to the plane spanned by the GAFa/b domains. The overall model thus assumes a twisted topology and the functional regions of the catalytic domain face in different directions (exemplified by arrows). (c) Electron density map of tPDE6 together with the remaining 3D variability (red) as estimated from the aligned particle images. The dominant variability localizes to the catalytic domains and the N-terminal feature. Scale bar is 50 Å.

