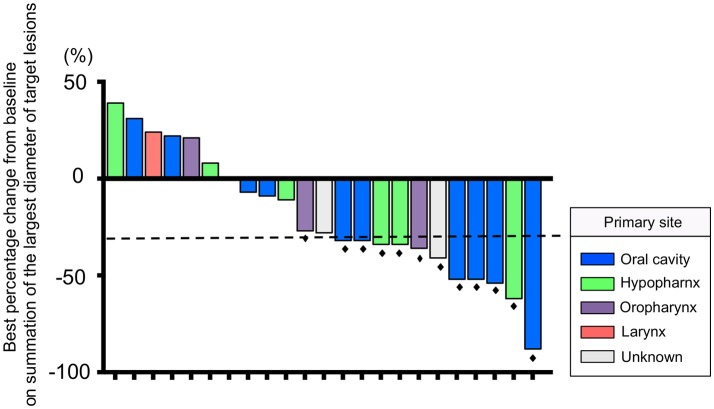
Figure 1.
Waterfall plot of the maximum percentage change from baseline on summation of the largest diameter of target lesions for 23 patients. The dashed line indicates a 30% reduction in tumor burden in the target lesion. Black dots indicate patients who had a response according to RECIST version 1.1.

