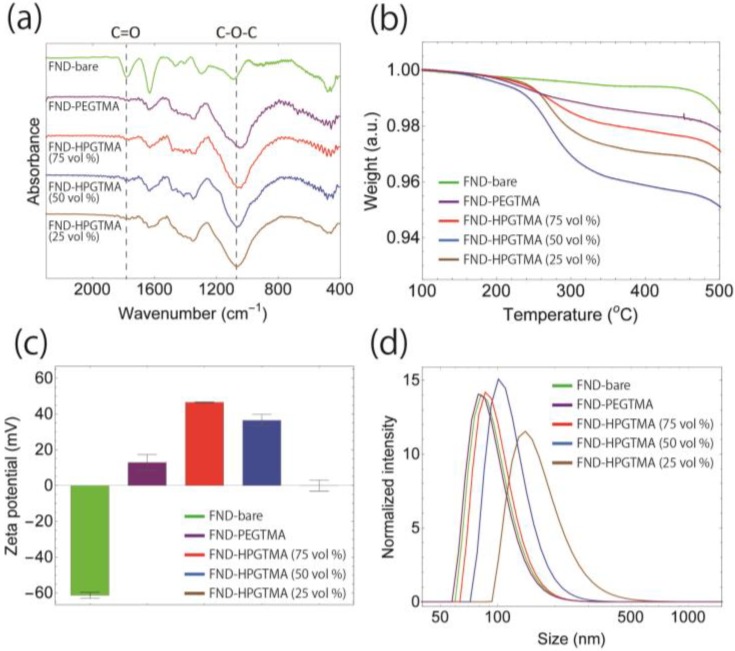
Figure 1.
Characterization of fluorescent nanodiamond (FND) samples with (a) Fourier transform infrared spectroscopy (FTIR); (b) thermogravimetry (TG); (c) zeta potential analysis; and (d) dynamic light scattering in DDW. Data of FND-bare, FND-PEGTMA, and FND-HPGTMA (GTMA/glycidol = 75, 50, and 25 vol %) are represented in green, purple, red, blue and brown, respectively. Values in (c) are means ± standard deviations of three measurements.

