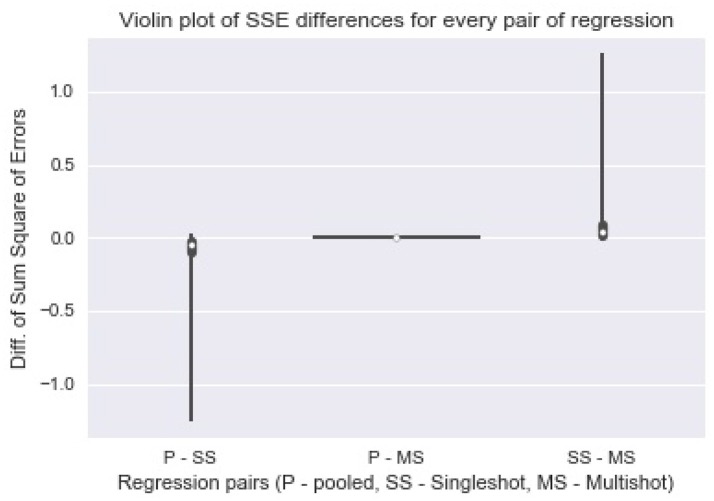
Figure 2.
Violin plot of Sum Square of Error differences between every pair of regression. The plot of differences in SSE from pooled regression and multi-shot regression (P-MS) centered around 0 demonstrates how identical the results from the two regressions are. On the other hand, the SSE values from single-shot regression are higher compared to those from the pooled regression.

