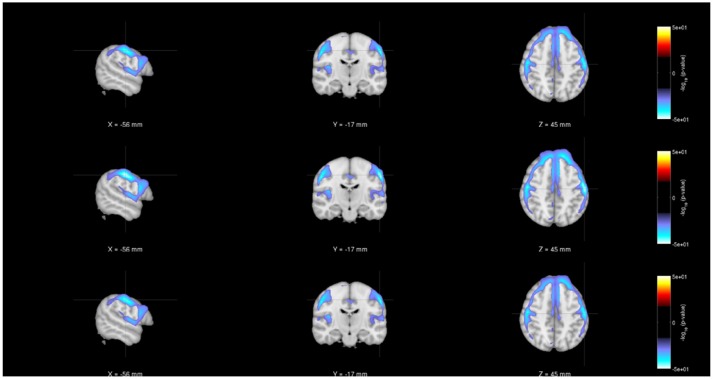
Figure 4.
Rendered images of voxel-wise significance values (−log10p-value × sign(t)) for the covariate “Age” from pooled regression (Top) and single-shot regression (Center), and multi-shot regression (Bottom) overlaid on MNI average template. One could see that the regions with expected gray matter decrease as age increases are similar from all kinds of regression. Although the single-shot regression uses fewer covariates, the similarity of the rendered images with those of pooled regression or multi-shot regression indicate the relative weight or orientation of the corresponding β coefficient will be similar to those from pooled/multi-shot regression.

