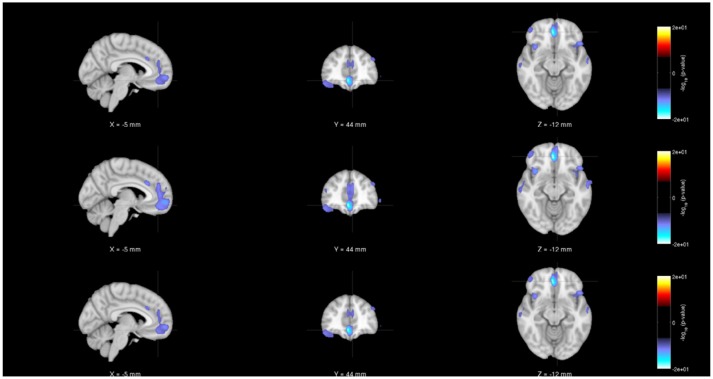
Figure 5.
Rendered images of voxel-wise significance values (−log10p-value × sign(t)) for the covariate “Diagnosis” from pooled regression (Top) and single-shot regression (Center) and multi-shot regression (Bottom) overlaid on MNI average template. Regardless of the type of regression performed, the images indicate that in the medial frontal and bilateral temporal lobe/insula there is a significant gray matter density reduction for schizophrenic patients compared to the same regions of the healthy subjects.

