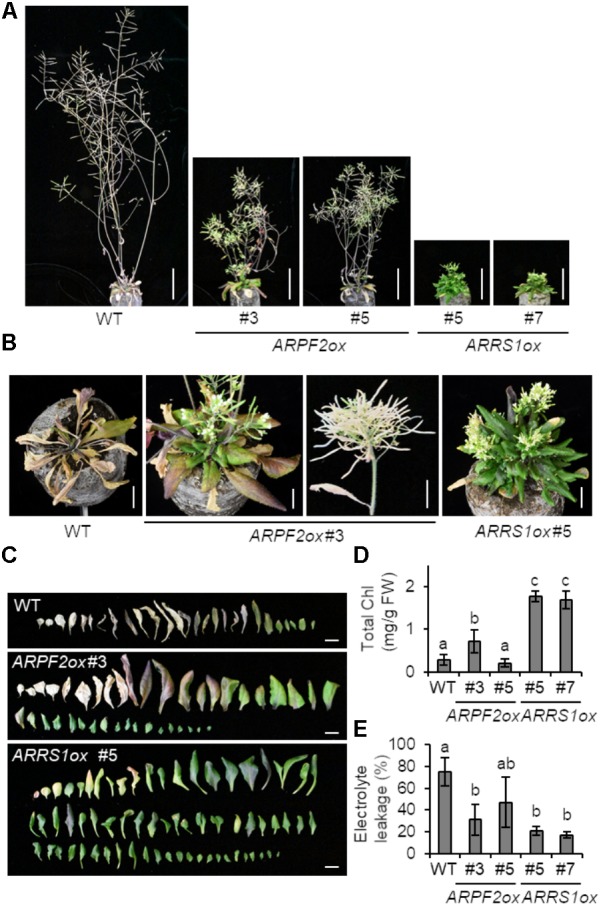
FIGURE 7.

Extended lifespan of plants overexpressing ARPF2 or ARRS1. (A) Photographs of the plants grown for 8 weeks. Scale bars: 5 cm. (B) Enlarged view of (A) (scale bars: 1 cm). (C) Phenotype of rosette leaves of plants grown for 5-weeks. Scale bars: 1 cm. (D,E) Quantification of total chlorophyll (Chl) (D) and cell death (E) of the plants grown for 8-weeks. The extent of cell death was assessed as relative electrolyte leakage (percentage of total electrolytes). Error bars indicate SD (n = 5). In (D,E), the statistical significance was determined by ANOVA, followed by a Tukey–Kramer test. Means that are significantly different from each other (p < 0.05) are indicated by different letters.
